Visualization of Common Algorithms
Visualization of Heap Operations
Visual operation of the max (min) heap algorithm, supports setting max or min heap, and supports operations such as insertion and deletion. Dynamically display the specific steps of the operation, helping to understand the heap operations.
Try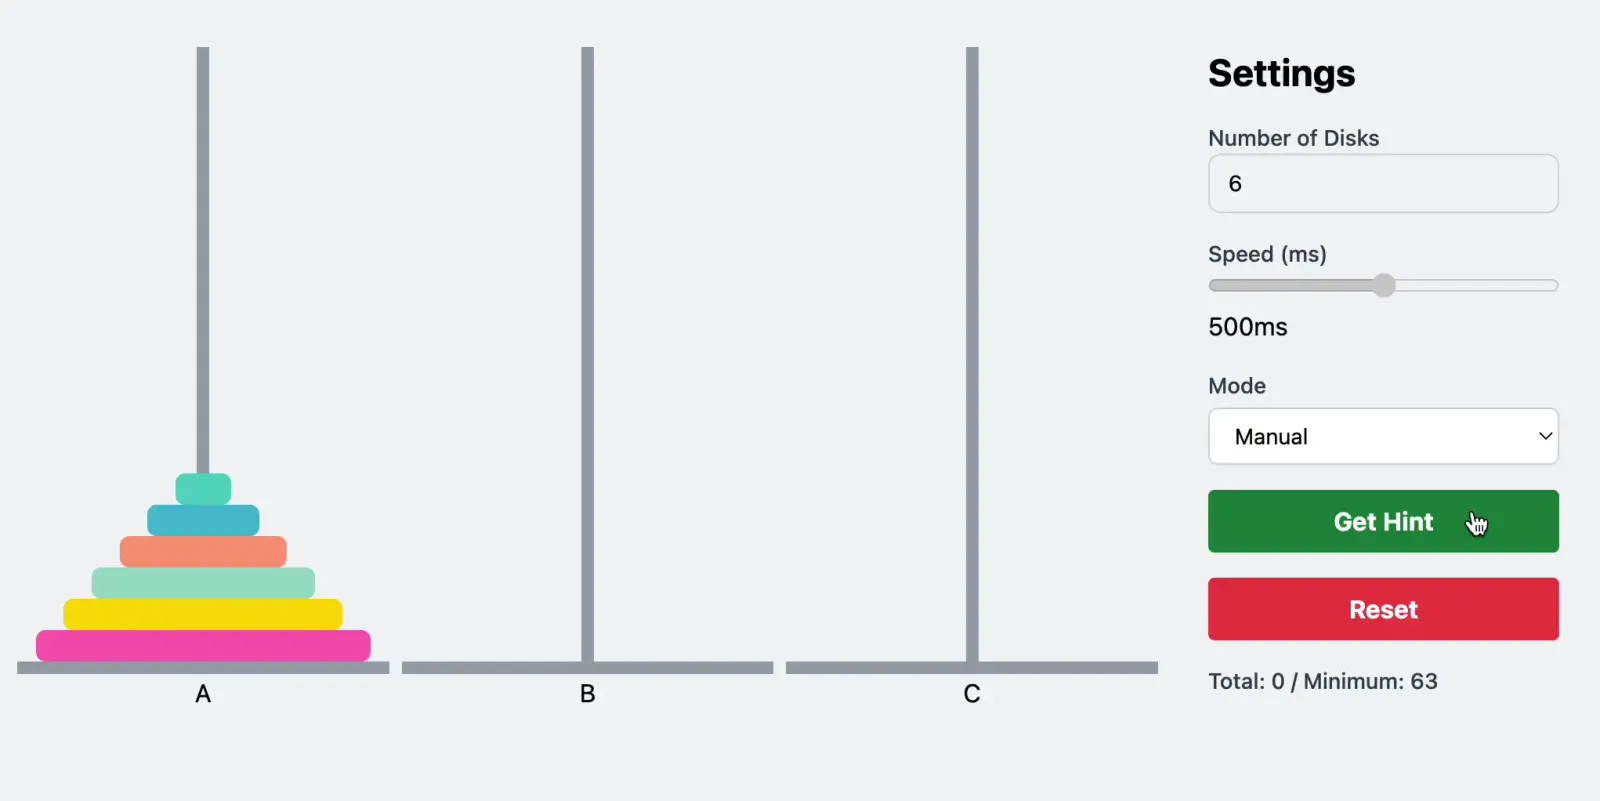
Play Tower of Hanoi Game Online
Experience the classic Tower of Hanoi game in an interactive web application. Challenge yourself with adjustable disk numbers, choose between manual and automatic modes, and receive hints to solve the puzzle.
Try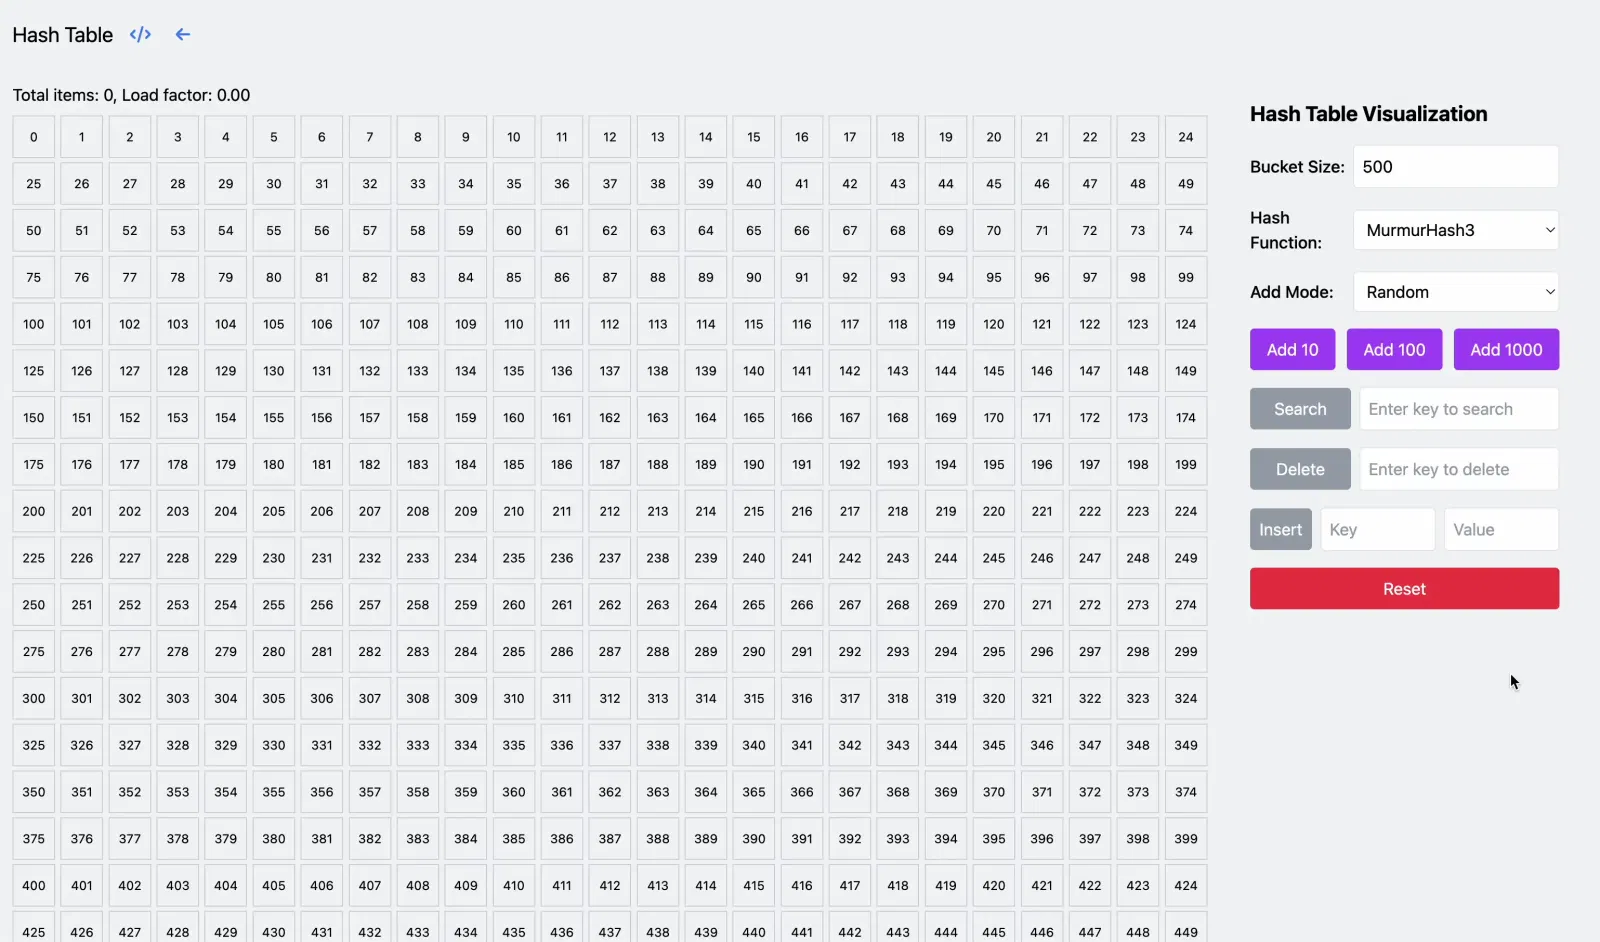
Visualization of Hash Table Operations
Hash table is a data structure that implements an associative array abstract data type, a structure that can map keys to values. This page shows the process of insert, delete and search for key-value pairs in the hash table.
Try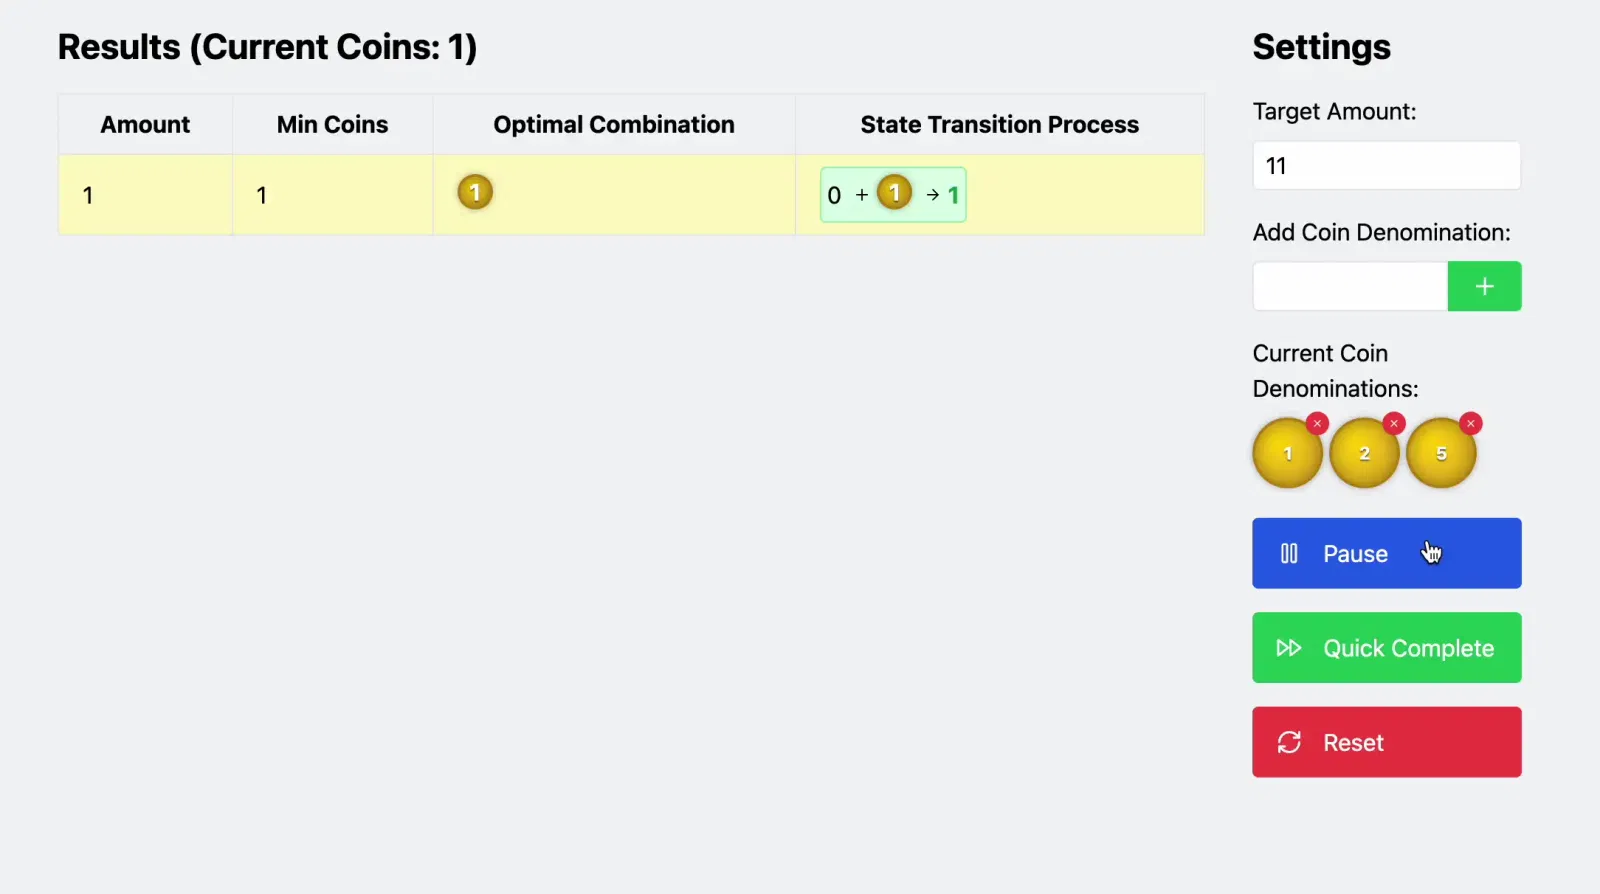
Dynamic Programming (Coin Change)
Visualization of the dynamic programming coin change algorithm. Set the target amount and the available coin denominations, click the step-by-step calculation button, and observe how the optimal solution is found step by step. The state transition process column of the output shows how the algorithm builds the solution of the larger problem from smaller problems.
Try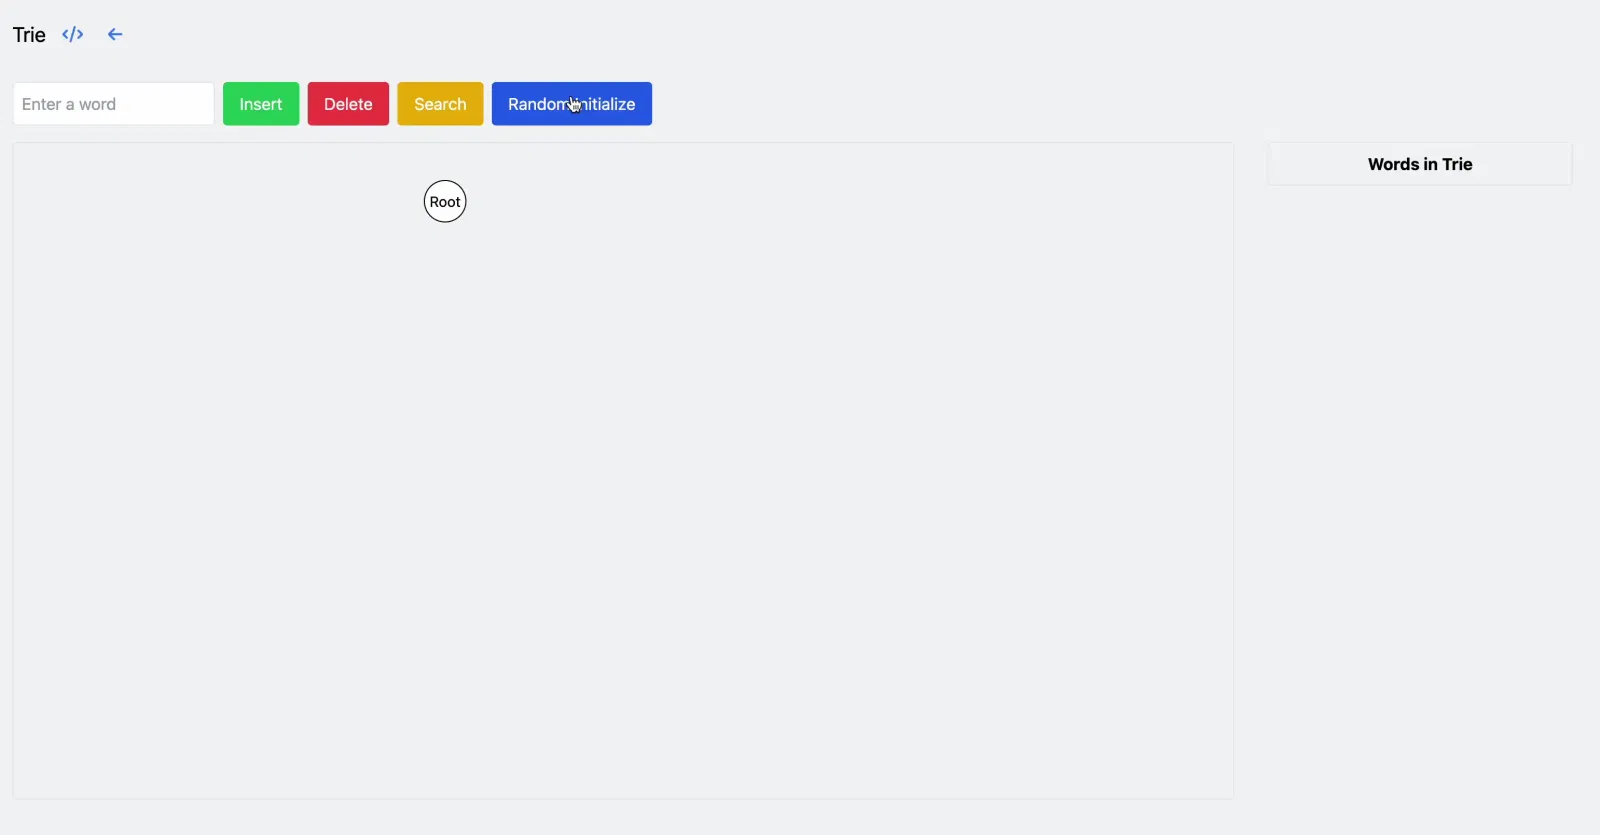
Trie Algorithm Visualization
Explore the visualization tool for Trie prefix tree operations. Interactive animation demonstrates the insertion, search, and deletion operations of words, providing a intuitive understanding of the working principle of Trie trees.
Try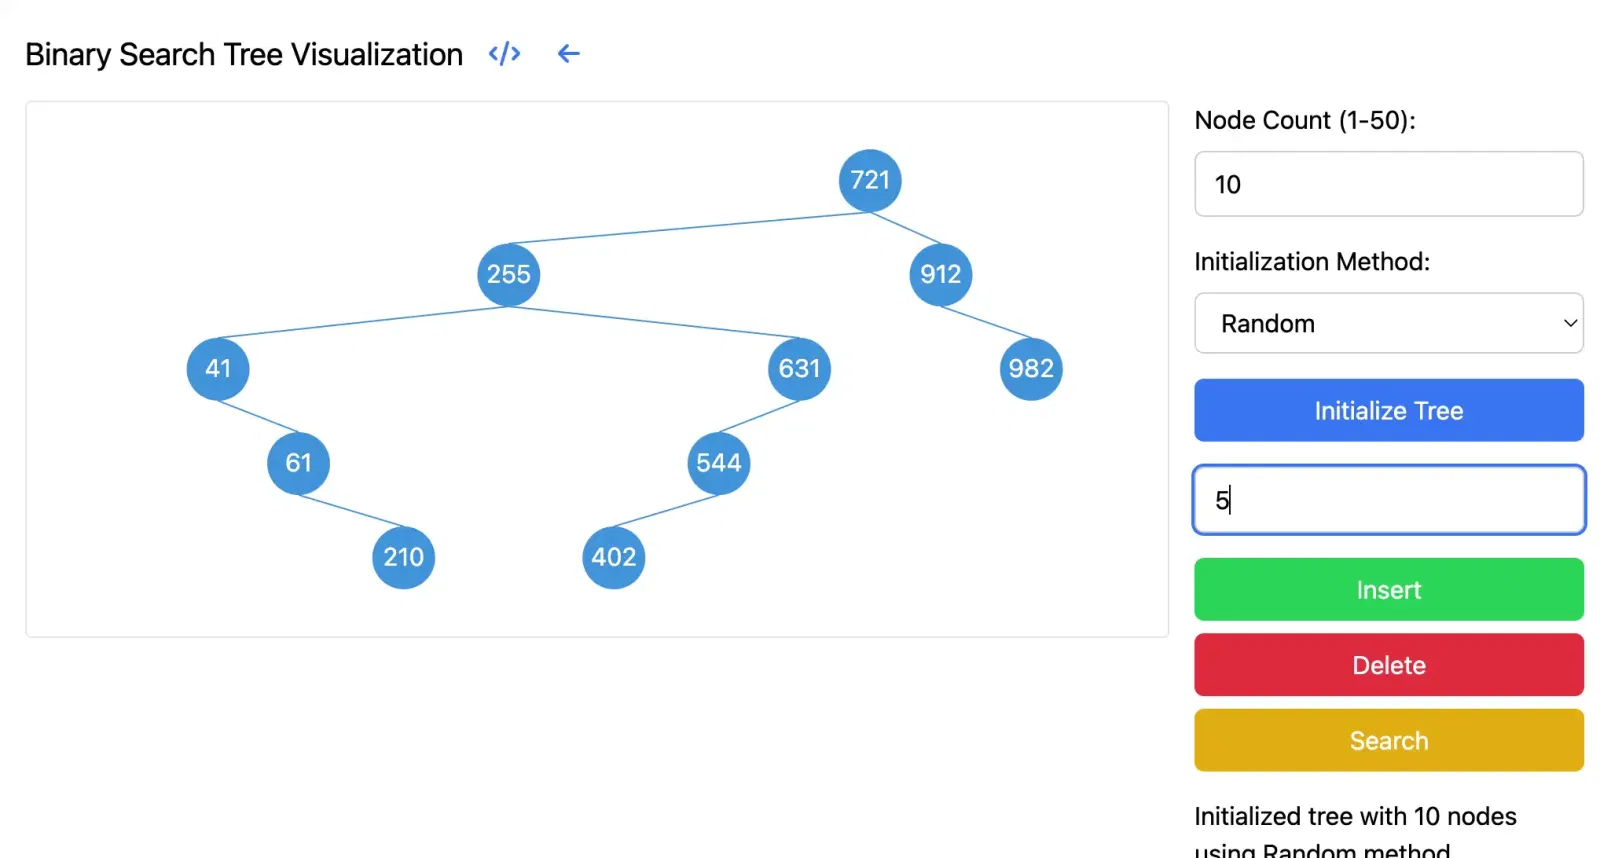
Binary Search Tree Visualization
Visualize the binary search tree algorithm. You can set the number of nodes and randomization method, insert, search, and delete nodes to understand how binary search trees work.
TryAVL Tree Visualization: Dynamic Balancing and Rotations
Interactive AVL tree visualizer focused on dynamic balancing after insert/delete, with step-by-step LL/LR/RR/RL rotations, balance factor updates, and subtree reconnection.
Try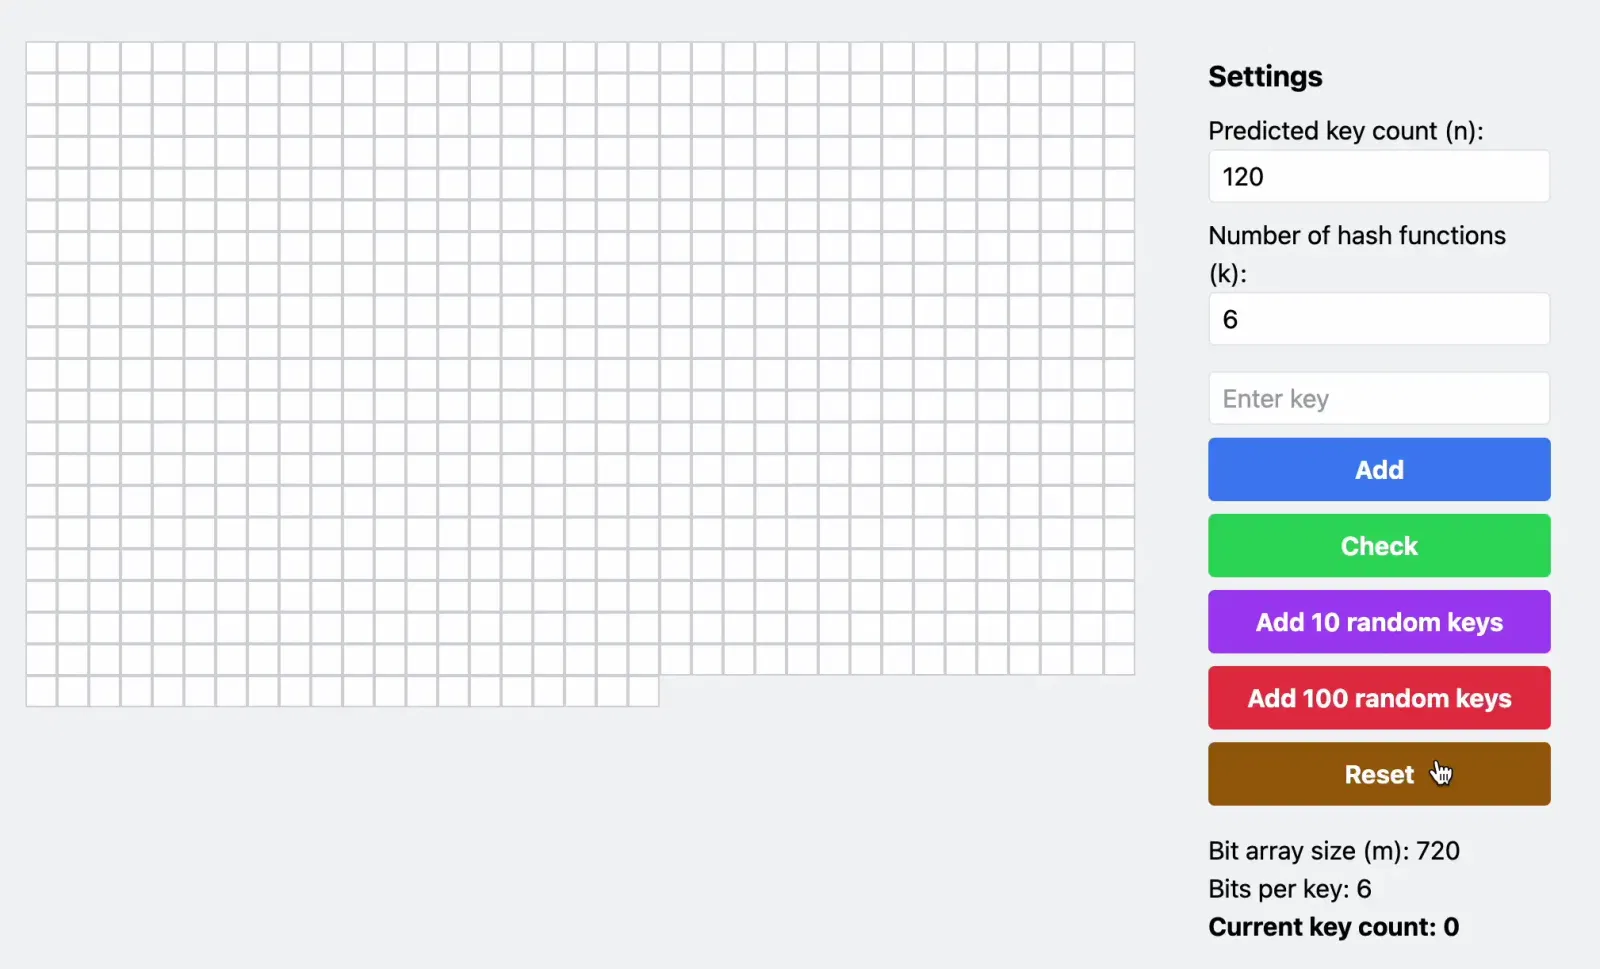
Bloom Filter Principle and Visualization
Bloom filter is a space-efficient probabilistic data structure that is used to test whether an element is a member of a set. This page allows you to visualize the process of adding keys to the bloom filter and checking for key existence.
Try
Dijkstra Algorithm Find Shortest Path
Visualize the Dijkstra algorithm to find the shortest path. You can customize an undirected graph, set the weight of the line, and then click Find Path to view the algorithm execution steps
Try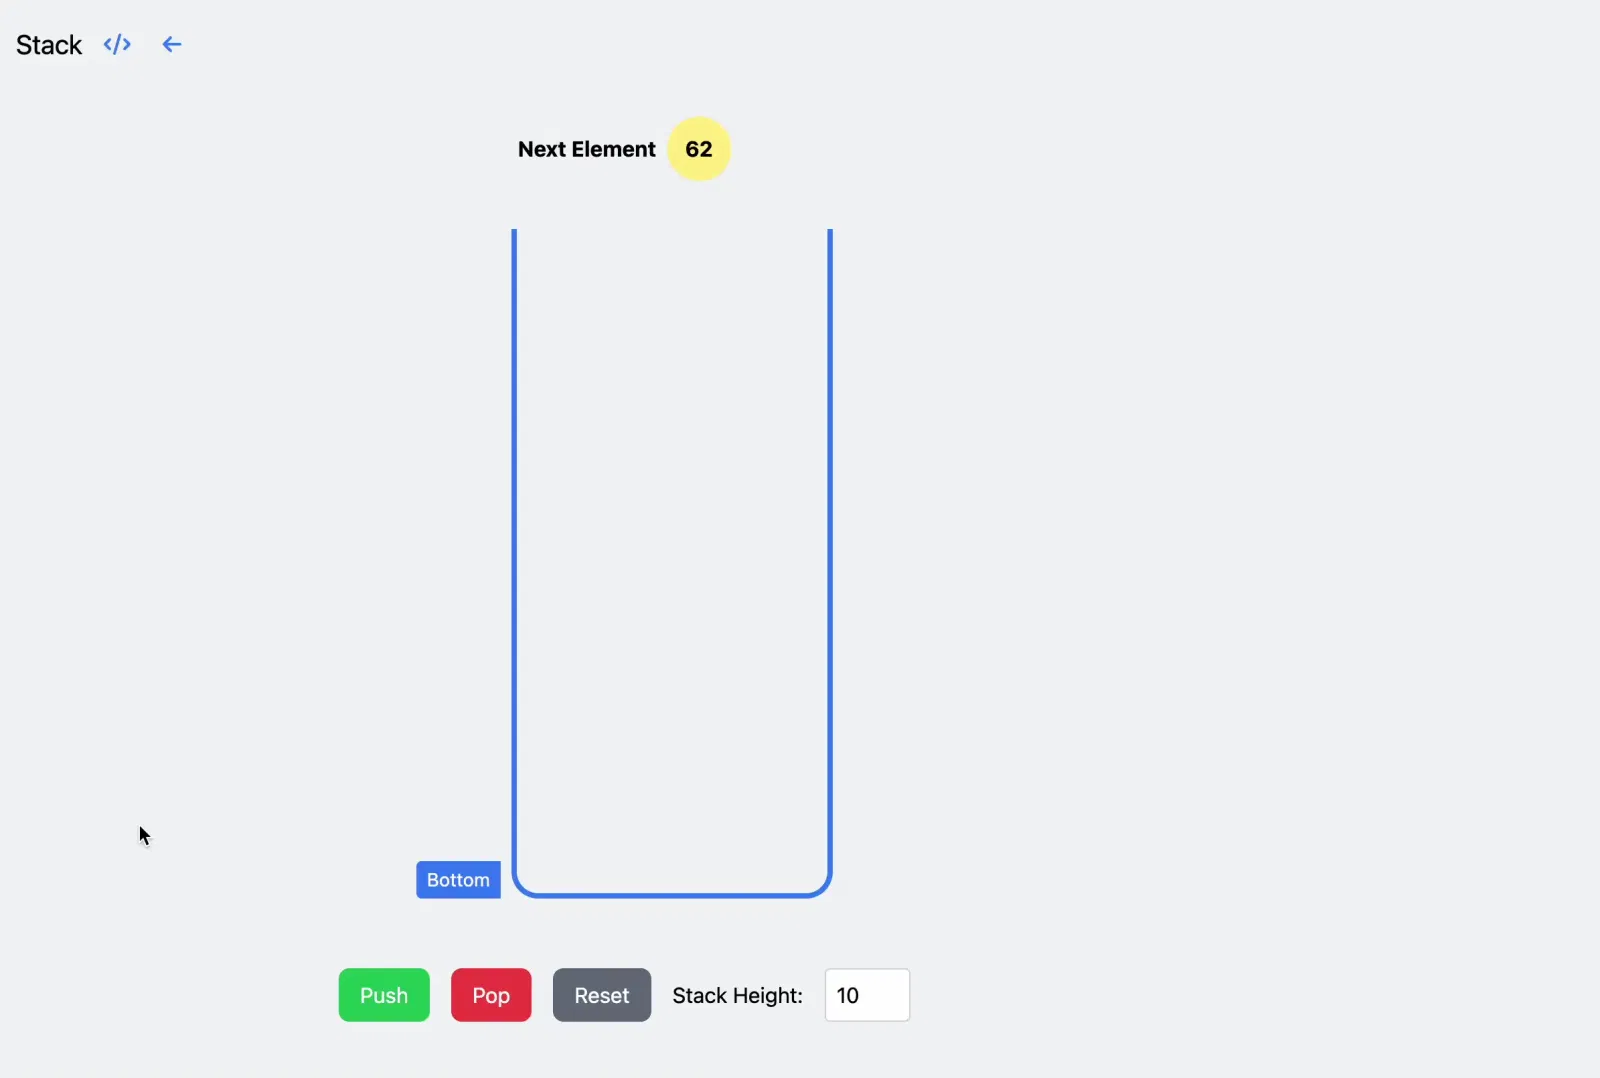
Visualization of Stack Data Structure
Stack is a linear data structure that follows the Last In First Out (LIFO). This page shows the process of push, pop and adjust the height. Dynamically displays the detailed content of stack operations, helping to understand stack operations.
Try
Consistent Hash Ring
The hash ring visualization of consistent hashing allows you to clearly and intuitively understand the key value allocation of consistent hashing, and add key value migration for deleting nodes. It also supports setting up virtual nodes (shadow nodes) to understand the effect of distribution balance optimization.
Try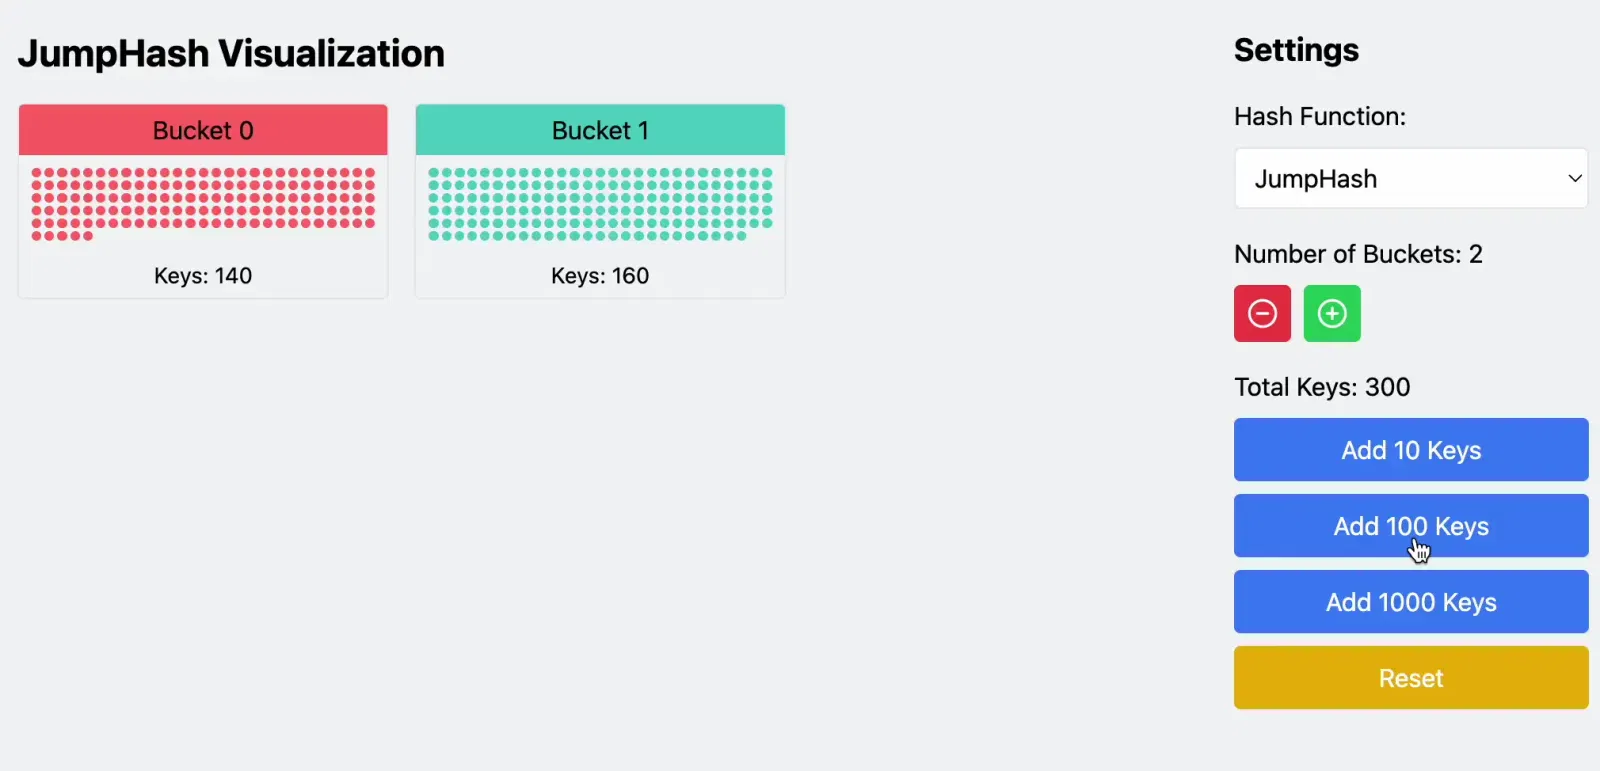
JumpHash
Jumphash is a consistent hashing algorithm that provides a balance between the number of keys assigned to each node and the number of nodes. This page allows you to visualize the process of adding keys to the jump hash and checking for key existence.
Try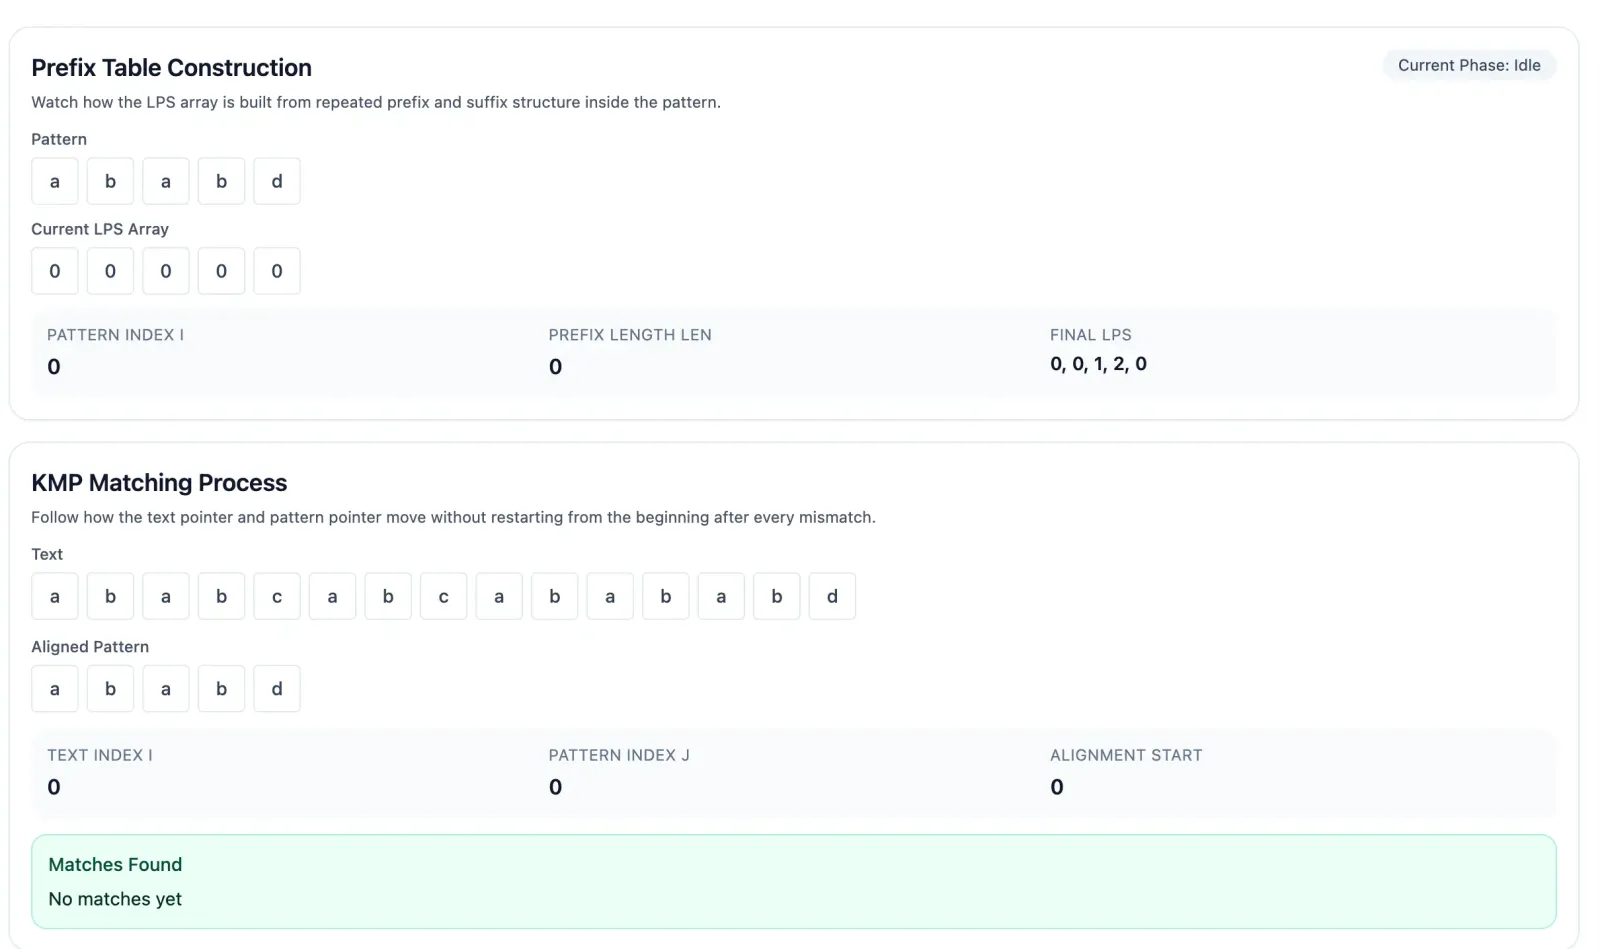
KMP String Matching Visualization
Interactive KMP visualization that teaches both prefix table construction and efficient pattern matching. Step through LPS building, mismatch fallback, and final match positions.
Try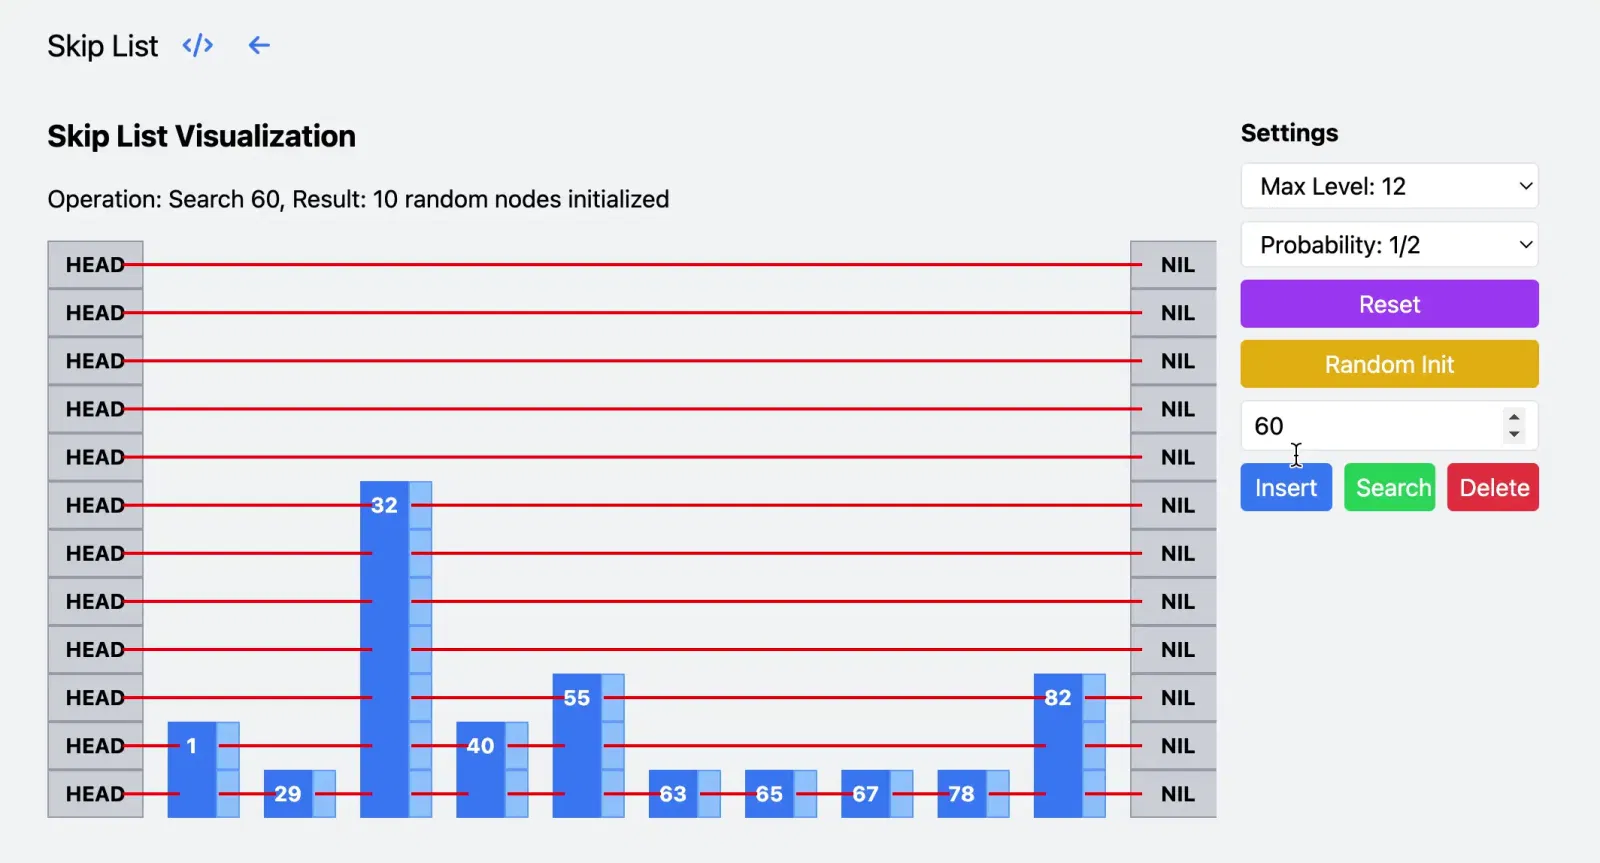
Skip List
Skip list is a data structure that allows fast search within an ordered sequence of elements. This page shows the process of insert, delete and search for elements in the skip list.
Try
A* Algorithm Find Shortest Path
Visualization of the A* pathfinding algorithm. Set obstacles, start and end points in a network, and watch the pathfinding process.
Try
BFS Pathfinding
Visualization of the Breadth-First Search pathfinding algorithm. Set obstacles, start and end points in a network, and watch the pathfinding process.
Try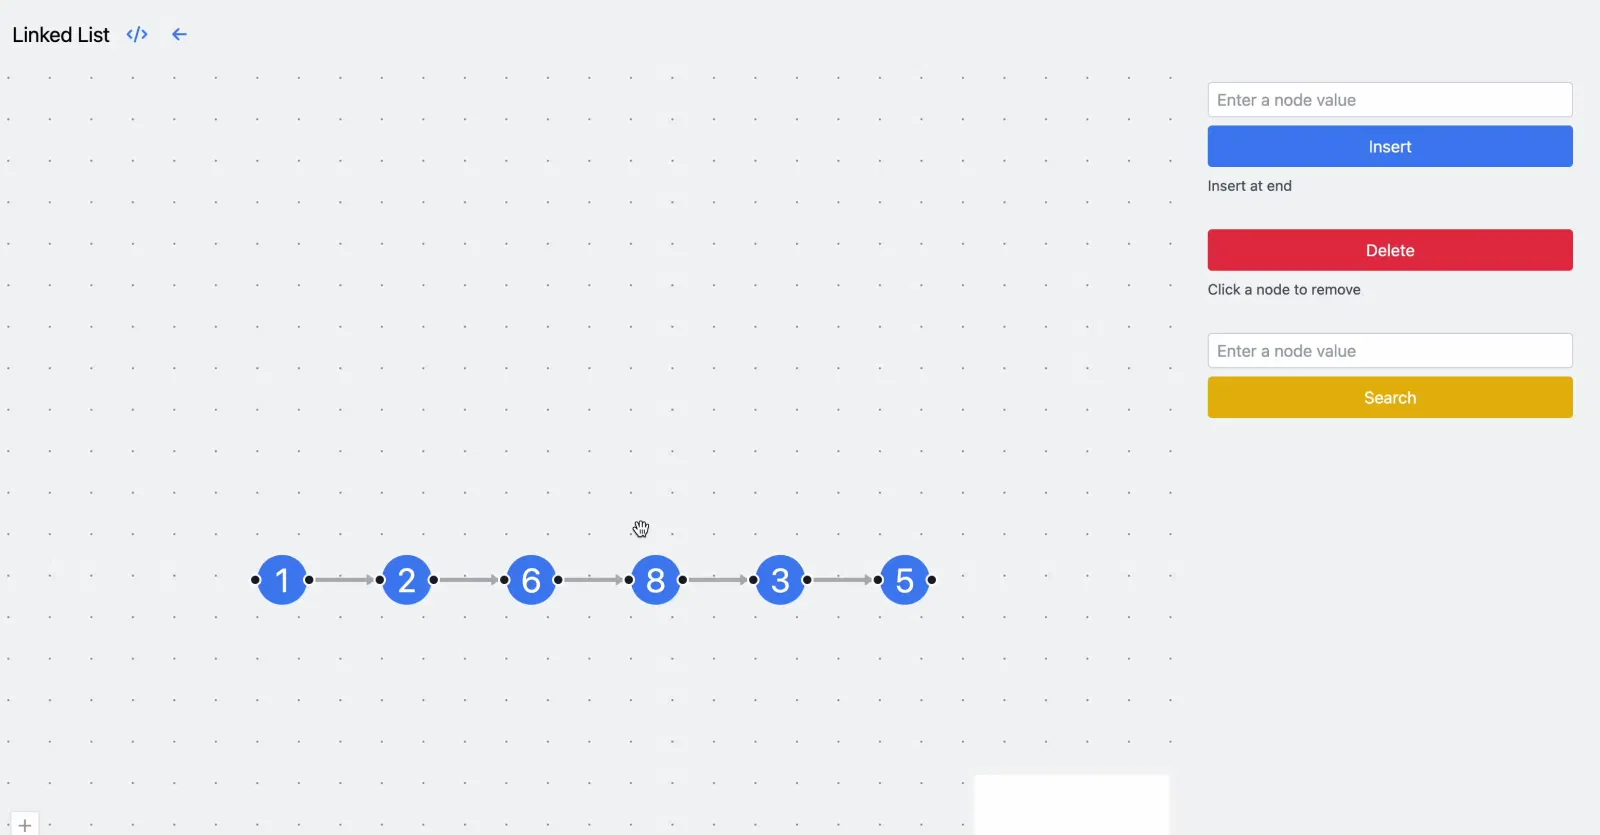
Linked List
Linked list is a linear data structure that consists of a sequence of elements, each element points to the next element in the sequence. This page shows the process of insert, delete and search for elements in the linked list.
Try
Rate Limit
Rate limiting is a strategy to control the rate of traffic sent or received by a network. Fixed window rate limiting and sliding window rate limiting are the most common rate limiting algorithms. This page shows the characteristics and comparison of these two algorithms.
Try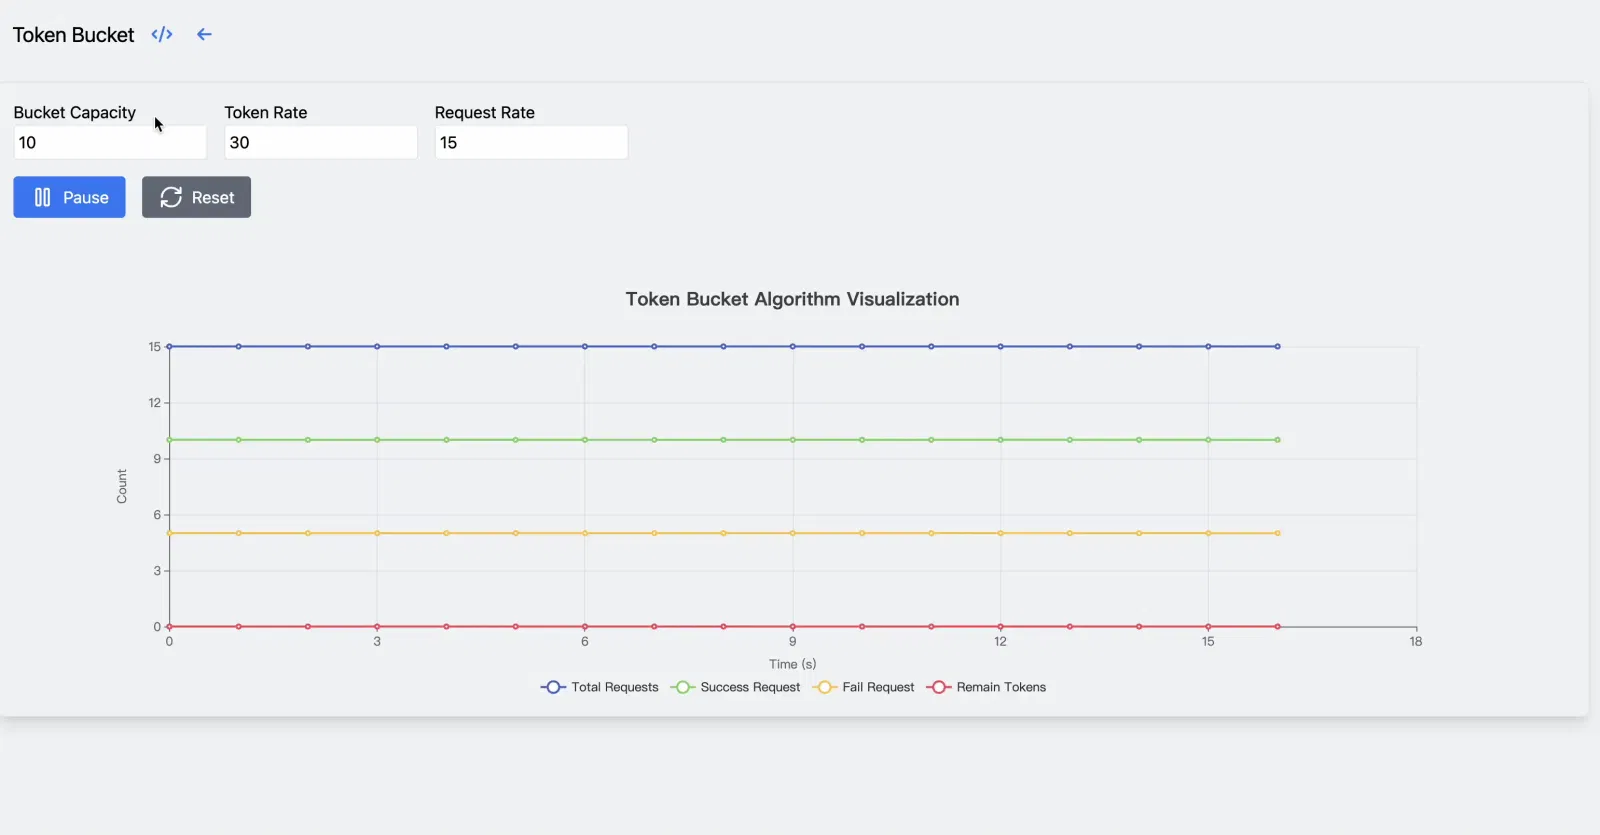
Token Bucket
Token bucket is a rate limiting algorithm that can be used to control the rate of traffic. You can set the bucket capacity, token generation rate, and request rate, and then draw the curve of successful or failed requests.
Try