How to Create a ChartRace Generate Tool with Claude3.5
From time to time, I see some beautiful racing chart pages online, showing how data changes over time, which looks really cool. After researching, I found that there are ready-made JS libraries that can generate such charts, but I couldn't find a suitable tool that could automatically generate racing charts after uploading data.
So I thought about implementing one using Claude3.5, but the process wasn't smooth, and I encountered quite a few pitfalls along the way. I started working on it in July, trying intermittently multiple times, until recently when I finally managed to implement a simple version. This article records the process of implementing this tool using Claude3.5 and documents the pitfalls encountered along the way. You can experience the final result here, and feel free to leave comments for discussion.
Failed Attempts
At the beginning, thinking it was relatively simple, I first looked for which libraries currently support dynamic racing charts.
I decided to use... so I directly prompted:
Help me implement a web tool using React that can generate dynamic racing charts based on JSON data uploaded by users.
It generated a rough code that required specific data to run. Moreover, the effect was poor, so I temporarily put it aside.
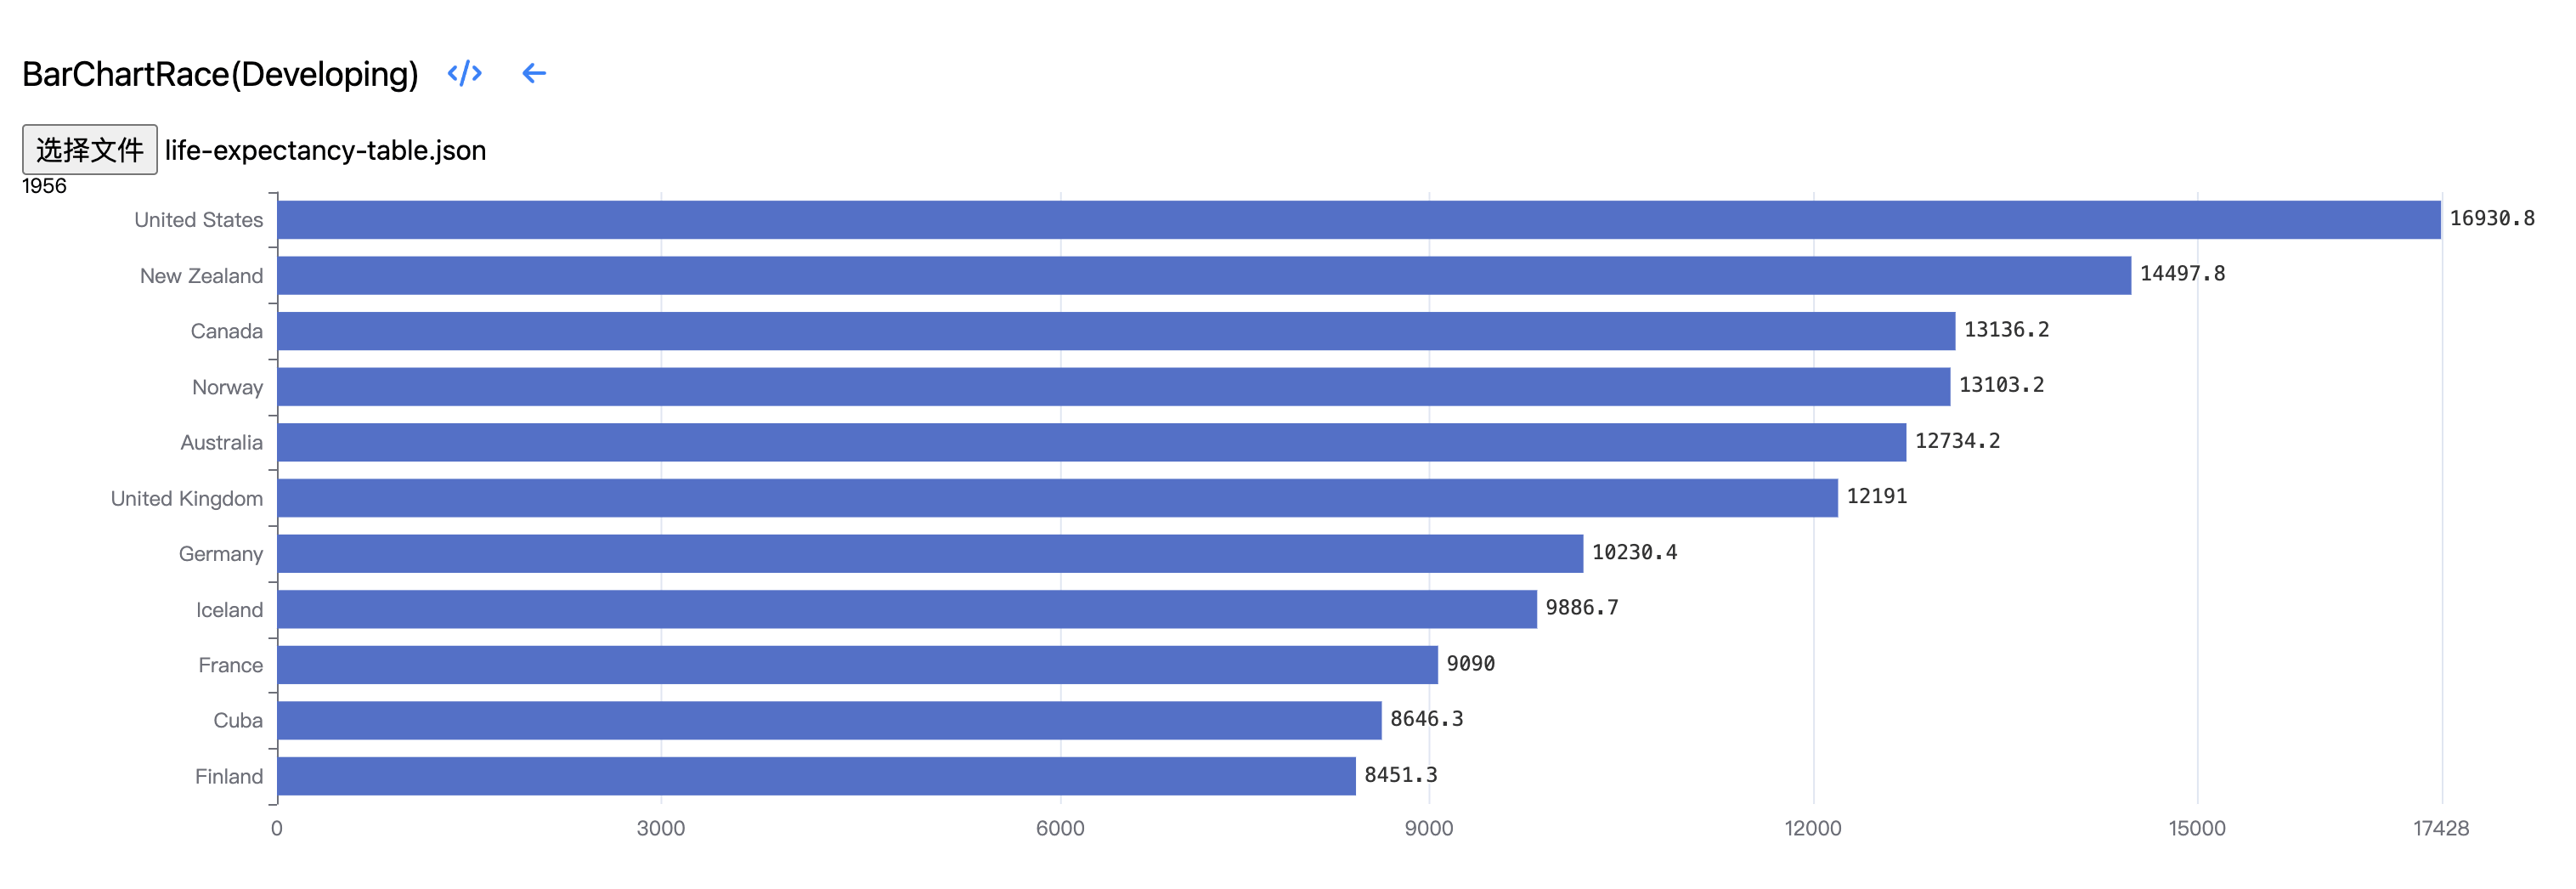
Continued Attempts
Recently, I've been quite comfortable using Cursor, so I thought I'd try again. The original code could parse JSON and run, so this time I wanted to support multiple points at once, allowing the input of Excel or CSV files, and customizing the data format.
I opened the original code, selected it, and directly prompted:
I want to support inputting Excel or CSV files, then generate racing bar charts. Implement it using ReactECharts, and improve the following code.
Then Claude3.5 asked me to import the Excel library, which is where I stumbled. It first asked me to import from xlsx, but what was installed was xlsx-js-style, which was the wrong version. After prompting to fix these small issues, I had it generate a sample dataset, thinking to test with the sample data. Although the sample data was short, the content was pretty good:
| Year | Category | Value |
|---|---|---|
| 2015 | Apple | 100 |
| 2015 | Banana | 80 |
| 2015 | Orange | 60 |
| 2015 | Grape | 40 |
| 2015 | Mango | 20 |
| 2016 | Apple | 120 |
| 2016 | Banana | 90 |
| 2016 | Orange | 70 |
| 2016 | Grape | 50 |
| 2016 | Mango | 30 |
| 2017 | Apple | 130 |
| 2017 | Banana | 110 |
| 2017 | Orange | 90 |
| 2017 | Grape | 70 |
| 2017 | Mango | 50 |
Here, the first column is time, the second column is category, and the third column is value. The name of each column can be customized. After uploading the file, it should generate a dynamic racing chart of different category values based on time. After getting a version working, I found that inputting CSV and Excel still didn't work; I had to first input Excel, then input a JSON to generate a simple racing chart. Not to mention how strange this process was, but the y-axis of this racing chart also didn't have category names.
To make it support names on the y-axis, I spent a long time and prompted several times without much success. The changes in between even caused the dynamic chart to stop working, so I added logs and found that there were problems with parsing the imported data. I had Claude3.5 repeatedly analyze for several rounds, but it still couldn't find a solution. It seems that Claude3.5 is not very suitable for this kind of complex analysis.
Dynamic Racing Chart Example
Alright, let's stop trying and instead look at how the official example does it. After all, only when you understand how to write it yourself can you guide AI to write it. The official example code is simple enough and looks good, as shown below:
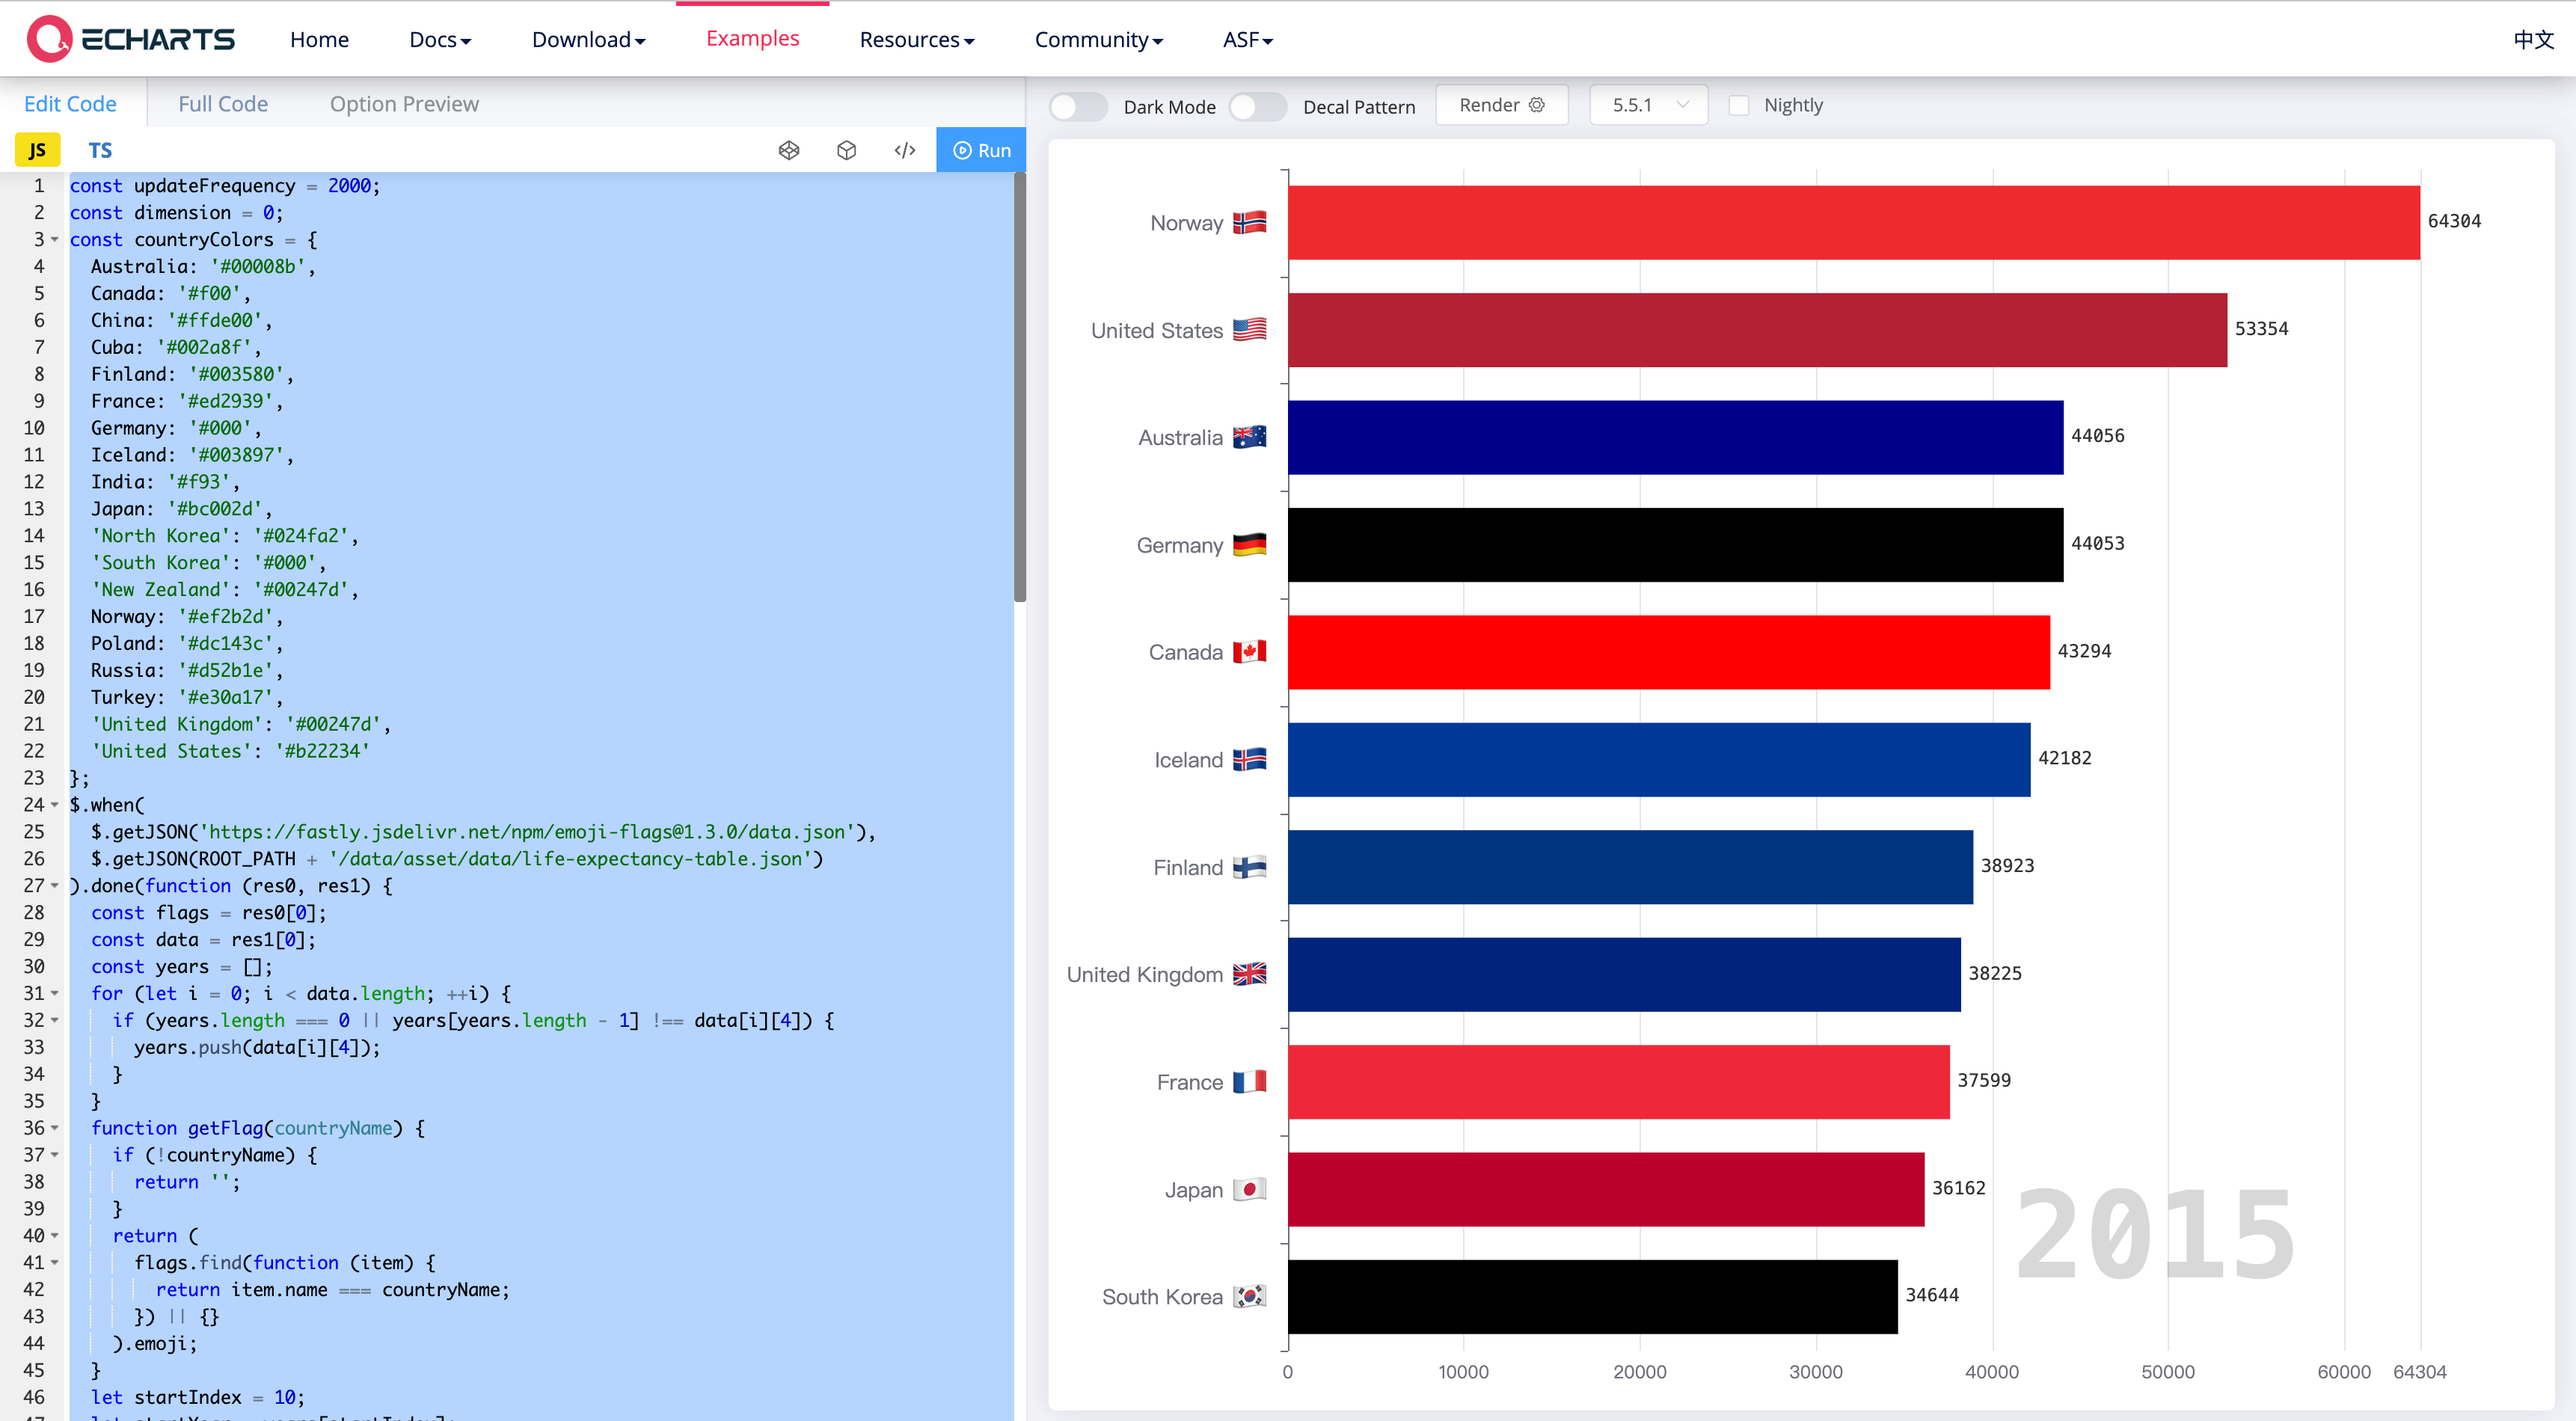
The code doesn't look very complicated. After importing the data, specifying the configuration for the dynamic racing chart, a dynamic racing chart can be generated quite simply. I provided this part to Claude3.5 for interpretation, asking it to use it as reference code, and it should be able to understand.
Now that we know the logic for generating dynamic racing charts, the rest is to handle the frontend page, allowing users to upload files, then parse the files and generate dynamic racing charts. Here, should we let AI generate all of this directly, which is quite complex, or should we manually break down the task and let Claude3.5 complete it bit by bit?
Breaking Down the Problem!
The task here is actually quite easy to break down. First, there's the part related to uploading and parsing JSON files, then we can add a file preview to help users understand the data. With the data in place, combined with the official example code from earlier, we can generate dynamic racing charts. Once all of this is done, we can slowly optimize and iterate on a working version, such as adding GIF export functionality, or supporting different colors, adding titles, etc. Later, if we want to support Excel or CSV, it's relatively simple, we just need to write the file processing part, and everything else can be reused.
File Upload and Preview
Let's look at the first part here. Directly have AI generate an upload component that can handle JSON files. At the same time, to avoid strictly limiting the file format, consider letting users choose certain columns as data sources for the chart. In fact, the data needed here mainly has 3 columns: time, category, and value. After uploading the JSON file, directly parse the column names inside and return selection boxes.
It's a bit difficult to describe directly, so to help Claude3.5 better understand, I directly drew a rough sketch for it, as shown below:

I asked it to implement based on this reference. However, after thinking about it, I decided to keep the overall page layout consistent with other parts of the site, so I moved the settings-related parts to the far right. The version implemented by Claude was not ideal and had some small issues, but I could continue to fine-tune the prompts:
No, you're not reading the uploaded JSON file here. You need to read the file content, judge if it's valid JSON, if it is valid JSON then output a preview. Otherwise, output a pop-up window, saying JSON parsing error.
For this pop-up window, create a new basic component with a close button, output in the center of the screen, with an overlay on top.
This time, a Modal overlay component was added, and not only file parsing errors would be output. When no data source is selected, a pop-up window would also be output, which was an unexpected surprise from Claude. For the preview part, the prompt didn't specify very detailed requirements, so Claude implemented it with a table. There were some small issues, but they were easily corrected.
Racing Chart Generation Part
With the upload part done and data preview available, the next step is to generate the racing chart. The prompt is also very simple:
Continue to improve the code here. Now after selecting the columns, clicking on generate chart should generate a racing chart based on the input JSON.
The racing chart should be in the section below the preview.
The racing chart can refer to this: const updateFrequency = 2000; ...
Here, I copied the complete racing chart code from the official example, which is not listed above. This time, the code generated by Claude3.5 was quite good, finally able to reproduce the official example. However, there were still some small issues, which I directly pointed out to Claude3.5:
There are two issues here:
- When clicking generate chart for the first time, a vertical bar appears first and gets stuck there, only after a while does the dynamic chart appear;
- When clicking generate chart subsequently, the previous unfinished one continues, causing two to overlap.
The first problem was perfectly solved in one go by including the first year's data when setting the initial chartOption, so the chart would display meaningful data from the start. For the second problem, the initial prompt might not have been very clear, causing the data to slowly return to the beginning after the second click. After providing a more detailed prompt, the problem was quickly resolved.
At this point, a working version was ready!
Challenges in Exporting GIF
To facilitate exporting GIFs, I first gave a simple prompt:
Can we support exporting the racing dynamic chart here? Generate a GIF or WebP dynamic image of the entire racing process, supporting download.
The first solution provided was to use the html2canvas library to capture each frame of the chart, and then use the gif.js library to composite these frames into a GIF animation. The first version didn't work, clicking on generate GIF would get stuck on "Generating GIF...". So I continued to refine the prompt:
What I want is:
- When generating the GIF, it shouldn't affect the racing chart currently on the site; now there are two racing charts constantly overlapping, which is not right.
- Generate the GIF in the background, don't wait for it to actually pass every second like this, it should support quickly generating the complete racing chart. After generation is complete, pop up a save window where the GIF can be saved.
Several versions were generated in between, but none could solve the problem. So I tried to have AI analyze the cause here and then provide logs for troubleshooting. Claude then added quite a few logs to the code, and during generation, it looked like this:
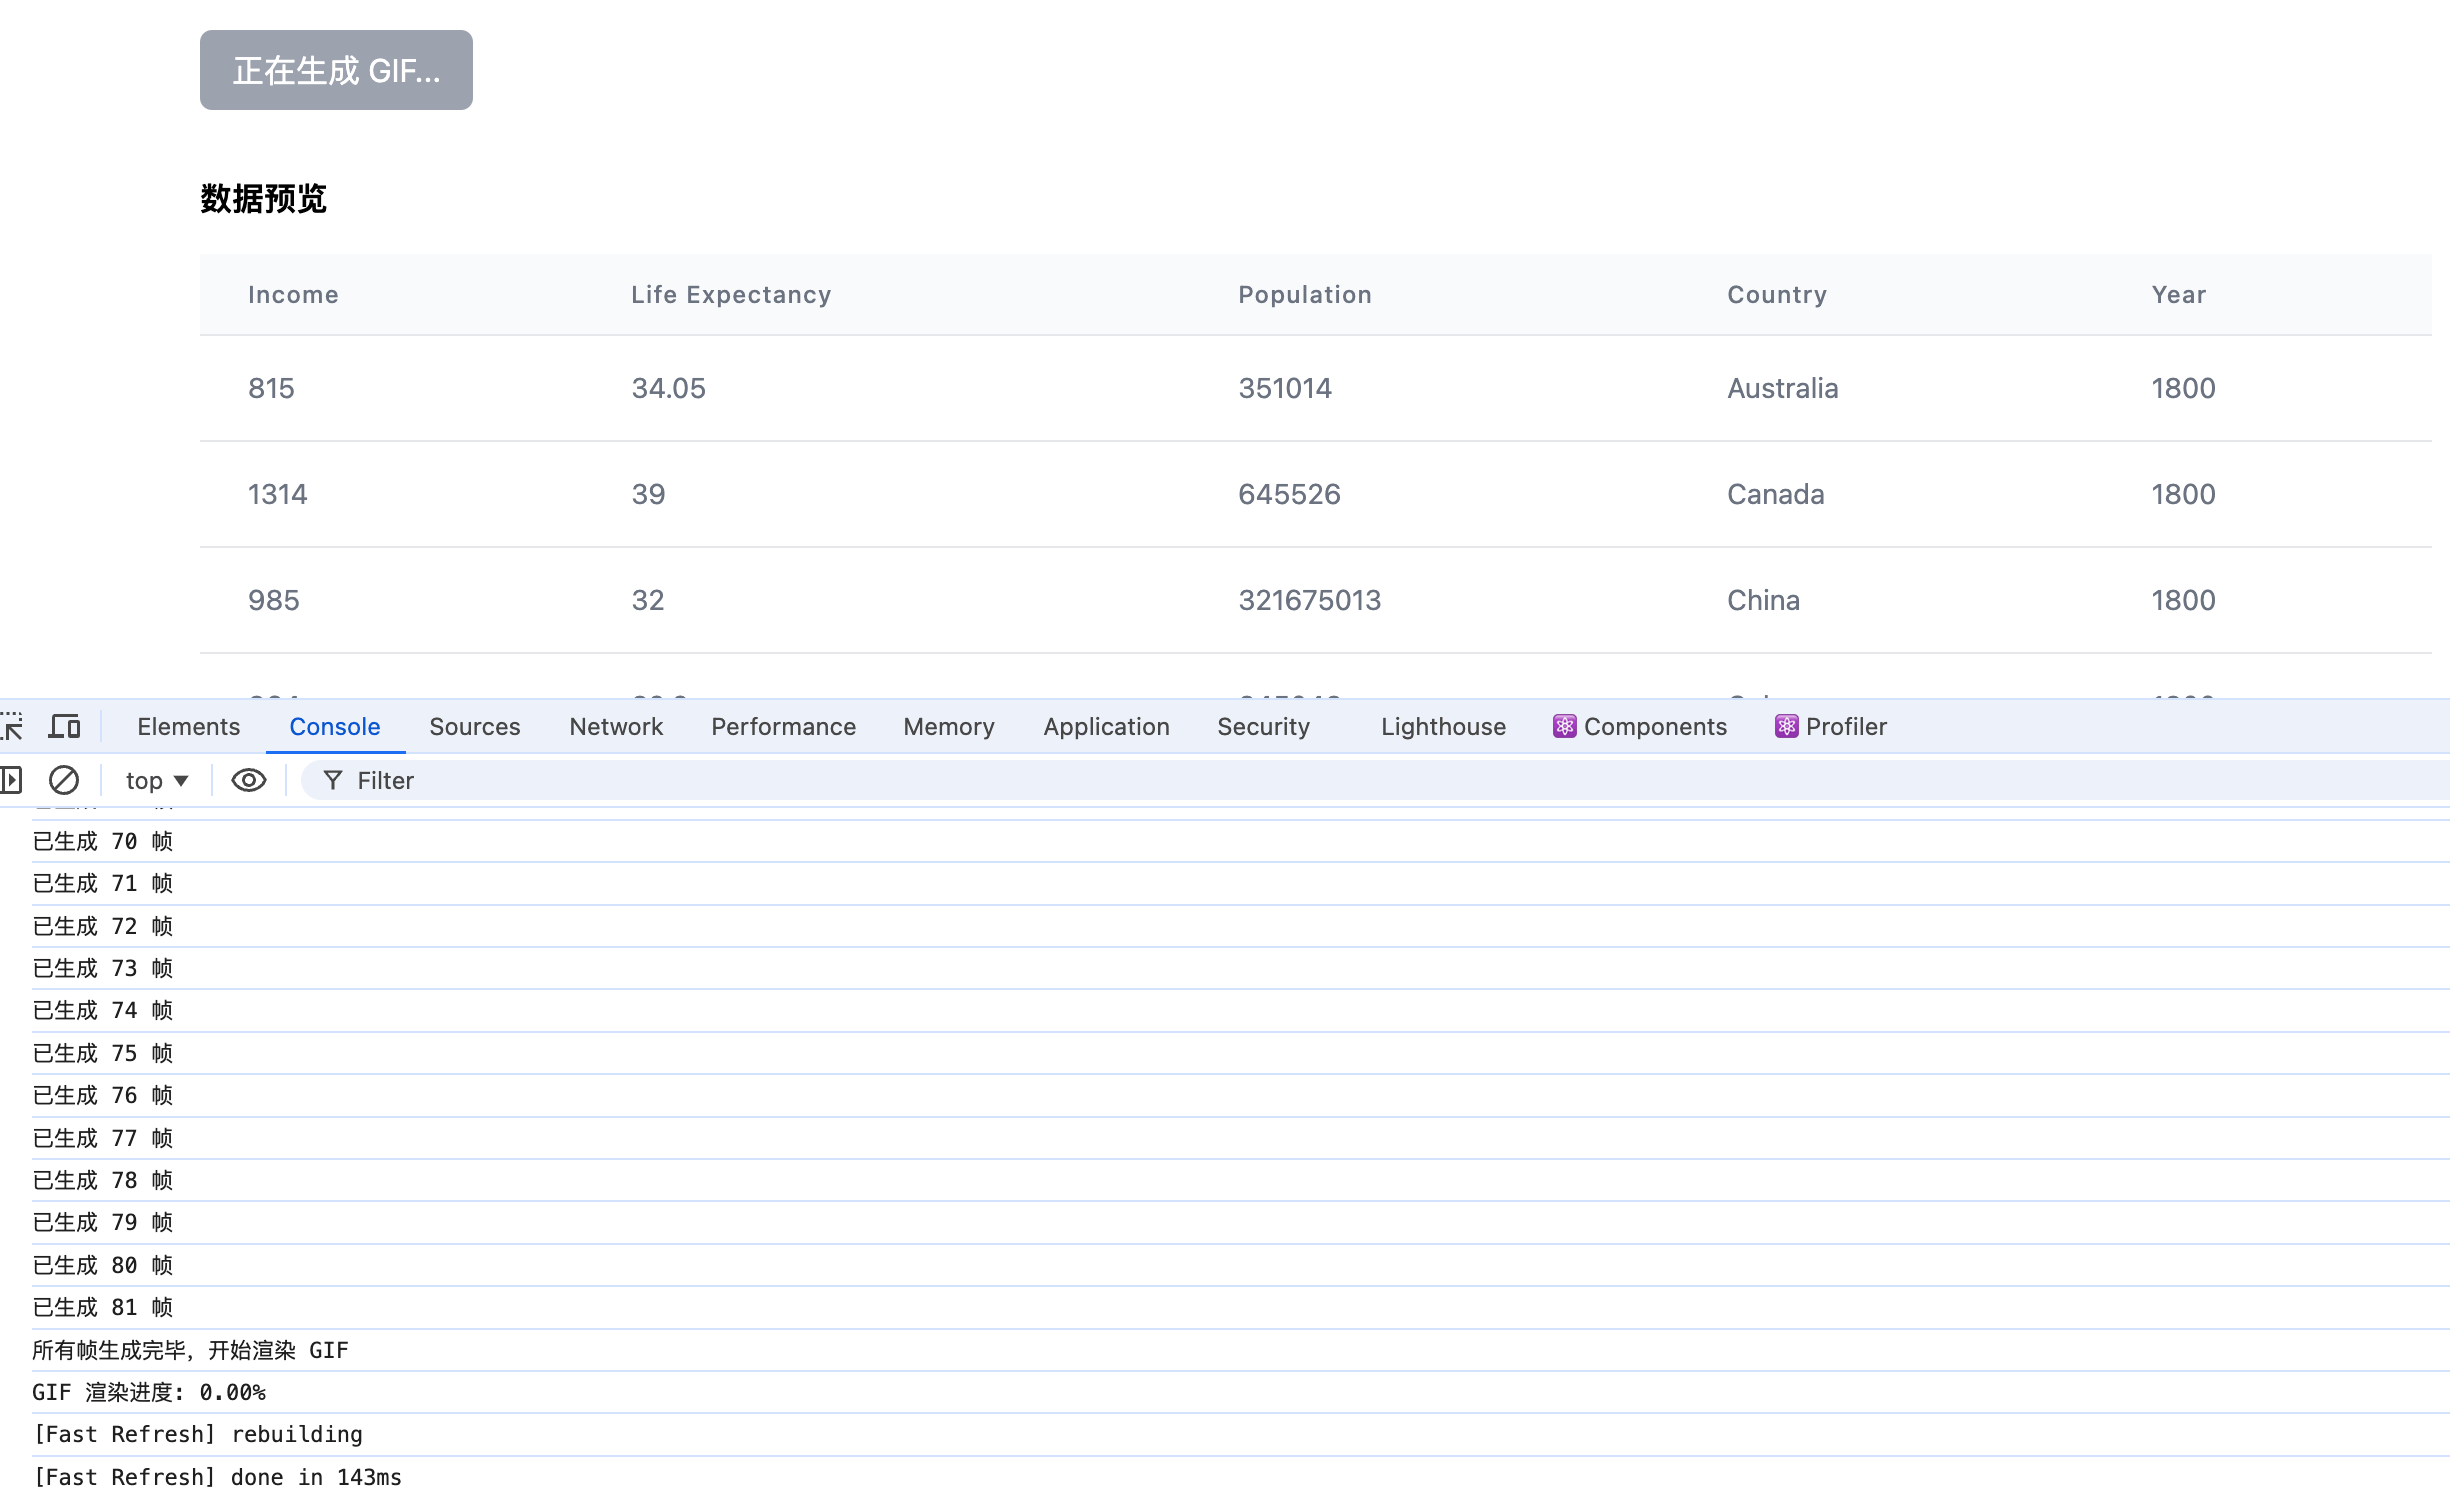
It was stuck on GIF rendering here. I showed the logs to Claude3.5 as well, but it still couldn't locate the problem. Here, I asked Claude3.5 to reflect on what might be causing the problem here, and it gave a bunch of possibilities:
- Image loading: gif.js needs fully loaded images to render correctly.
- Canvas size: Ensure the canvas dimensions are set correctly.
- Frame addition method: Ensure frames are correctly added to the GIF object.
- Memory usage: A large number of frames may cause memory issues.
- Asynchronous operations: Ensure all frames are added before calling the render() method.
After eliminating them one by one, there was still a problem. I went to look at the official documentation of gif.js, but still had no clue. Patiently looking at the code generated by AI again, I found that when creating the gif object, it was like this:
const gif = new GIF({
    workers: 4,
    quality: 10,
    width: canvasWidth,
    height: canvasHeight,
    workerScript: '/path/to/gif.worker.js' // Make sure to set the worker script path correctly
});
I asked Claude3.5 about the purpose of this file and how to set it up. The gif.worker.js file contains the core logic for GIF encoding. It runs in a Web Worker, allowing the GIF encoding process to occur in the background without blocking the main thread. After installing the gif.js library in a Next.js project, you can find the gif.worker.js file in the node_modules directory, copy it to the public directory, and then set it to /gif.worker.js.
It seemed correct, but it still didn't work when run! After trying several rounds of dialogue, it was still stuck at rendering GIF. Claude3.5 seemed to be stuck in a rut, so I started a new dialogue and tried GPTo1 instead. The prompt was also very brief:
Frame 80 generated and added content.js:241 Frame 81 generated and added
content.js:224 All frames generated, starting to render GIF
content.js:226 Calling gif.render()
content.js:250 GIF rendering started
content.js:252 GIF rendering progress: 0.00%The GIF rendering is stuck at 0% progress here, it doesn't seem to have started. Help me solve this.
Haha, here 'gif' was even misspelled as 'gjf', but GPTo1 quickly understood and provided a direction:
It looks like your GIF rendering process is stuck at 0.00% progress, which is usually related to issues with loading gif.worker.js. Here are some possible causes and solutions:
- Confirm the path of gif.worker.js
Make sure the gif.worker.js file is in the correct location and the path /gif.worker.js is accessible. If you've placed gif.worker.js in the public folder, ensure it can be accessed via the browser. For example, accessinghttp://localhost:3000/gif.worker.jsshould show the file content.- Check browser console errors
Open the browser's developer tools and check if there are any errors related to loading gif.worker.js. If there's a 404 error, it means the path is incorrect; if there's a cross-origin issue, you might need to adjust the server configuration.
I tried it and found that the path was redirected when accessed. Suddenly I remembered that when supporting old links without language versions, I added automatic redirection in middleware.js, which would add language to the link. For example, accessing https://gallery.selfboot.cn/tools/chartrace would automatically redirect to https://gallery.selfboot.cn/en/tools/chartrace/. The fix here was simple: remove the automatic redirection for gif.worker.js, and then try exporting again, and it worked.
Other Detail Optimizations
With the major functionality points completed, it's time to use Cursor to optimize some details. I have to say, for simply completing small detail tasks, Claude 3.5's accuracy is quite high. For example:
- Modify the background color of the generated dynamic GIF image;
- Change the downloaded file name to the uploaded file name with a .gif extension;
- Move the export GIF button to the right settings page, and support progress bar display during export;
- Support custom input of title;
- Randomly generate colors for each data entry, ensuring color combinations are reasonable;
- Modify the code to support multiple languages, generate translation files.
If I were to write these tasks myself, although I could implement them, it would still take quite a bit of time. Using Claude3.5 to complete these detail tasks is much easier.
Cursor Claude3.5 Deficiencies
During use, I found that Cursor still has quite a few issues. After generating code, when clicking Apply, I found that in the diff of changes, sometimes it would delete already written code and replace it with comments. So for changes, you can't blindly Apply, you need to manually check.
Additionally, during the writing process, for example, if you casually change one place, the AI might change it back when generating later. For instance, in the image below, I had already changed the time here to 500ms, but every time I Applied, it would change back to 2000:
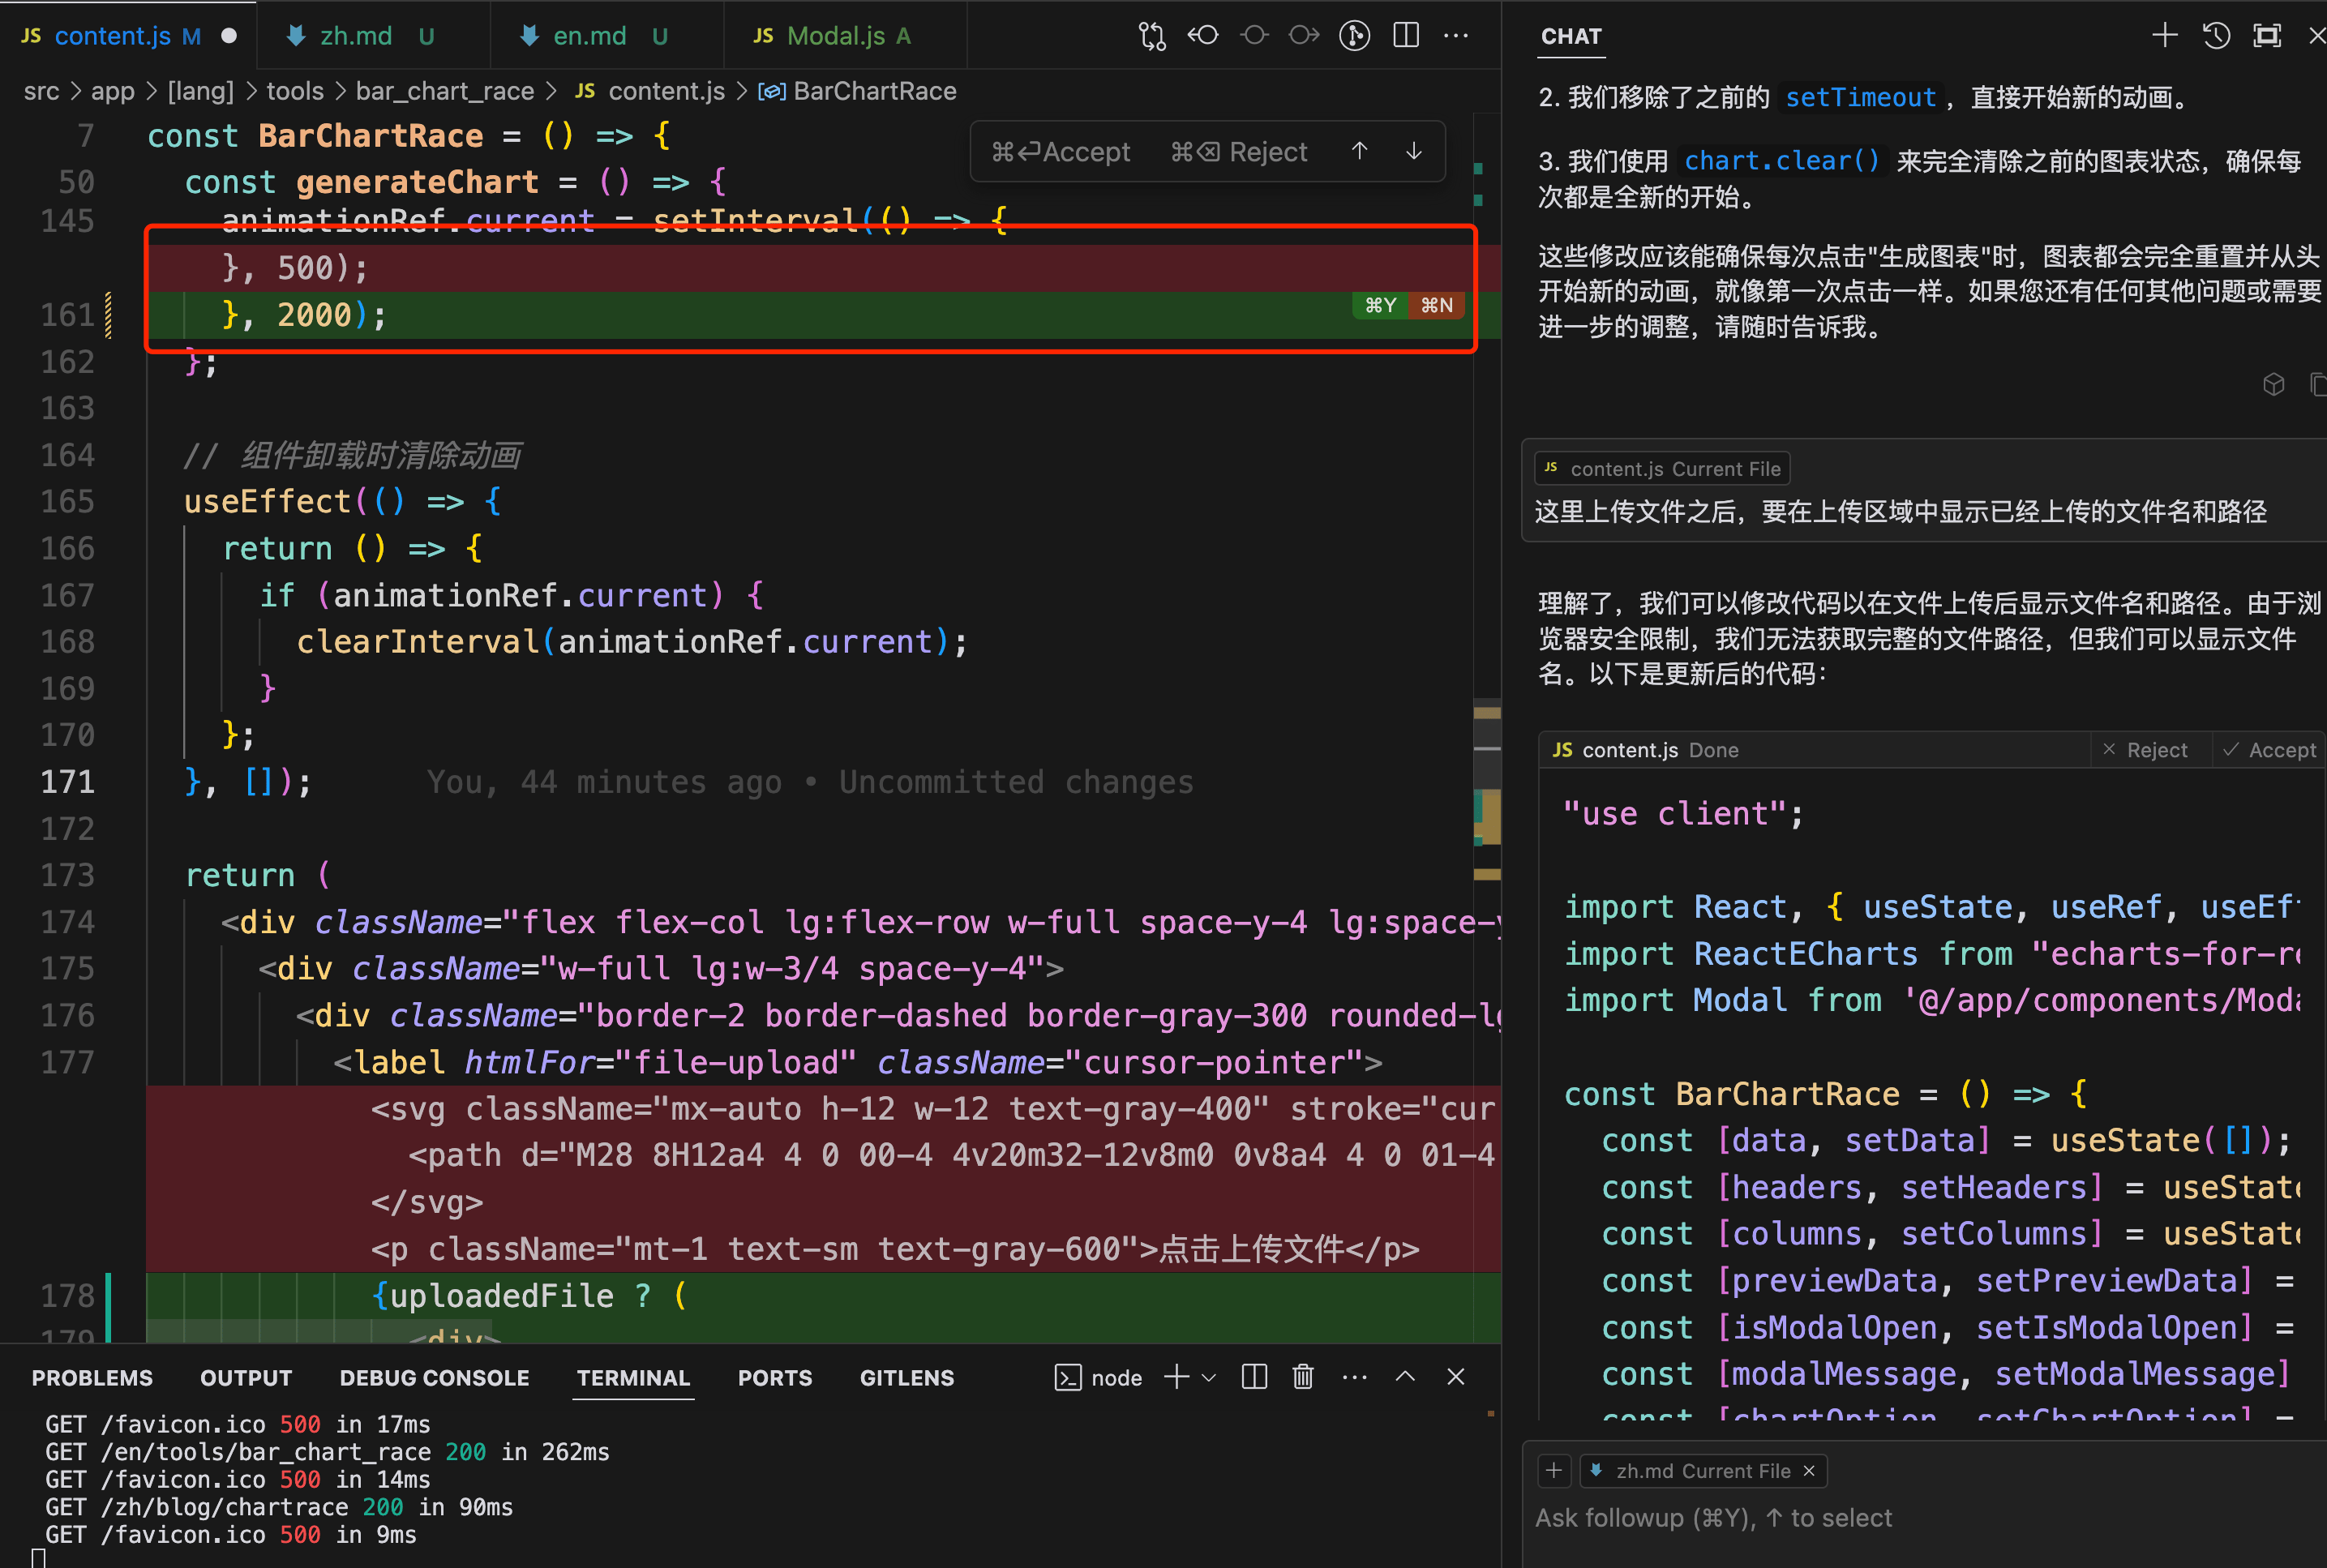
I guess here it might be that when Cursor selects the code version, it's not using the version in the current editor. Instead, it maintains a code version in the context itself, and then generates new code based on the maintained version. Later, when diffing, it used the old version to overwrite the version changed in the editor.
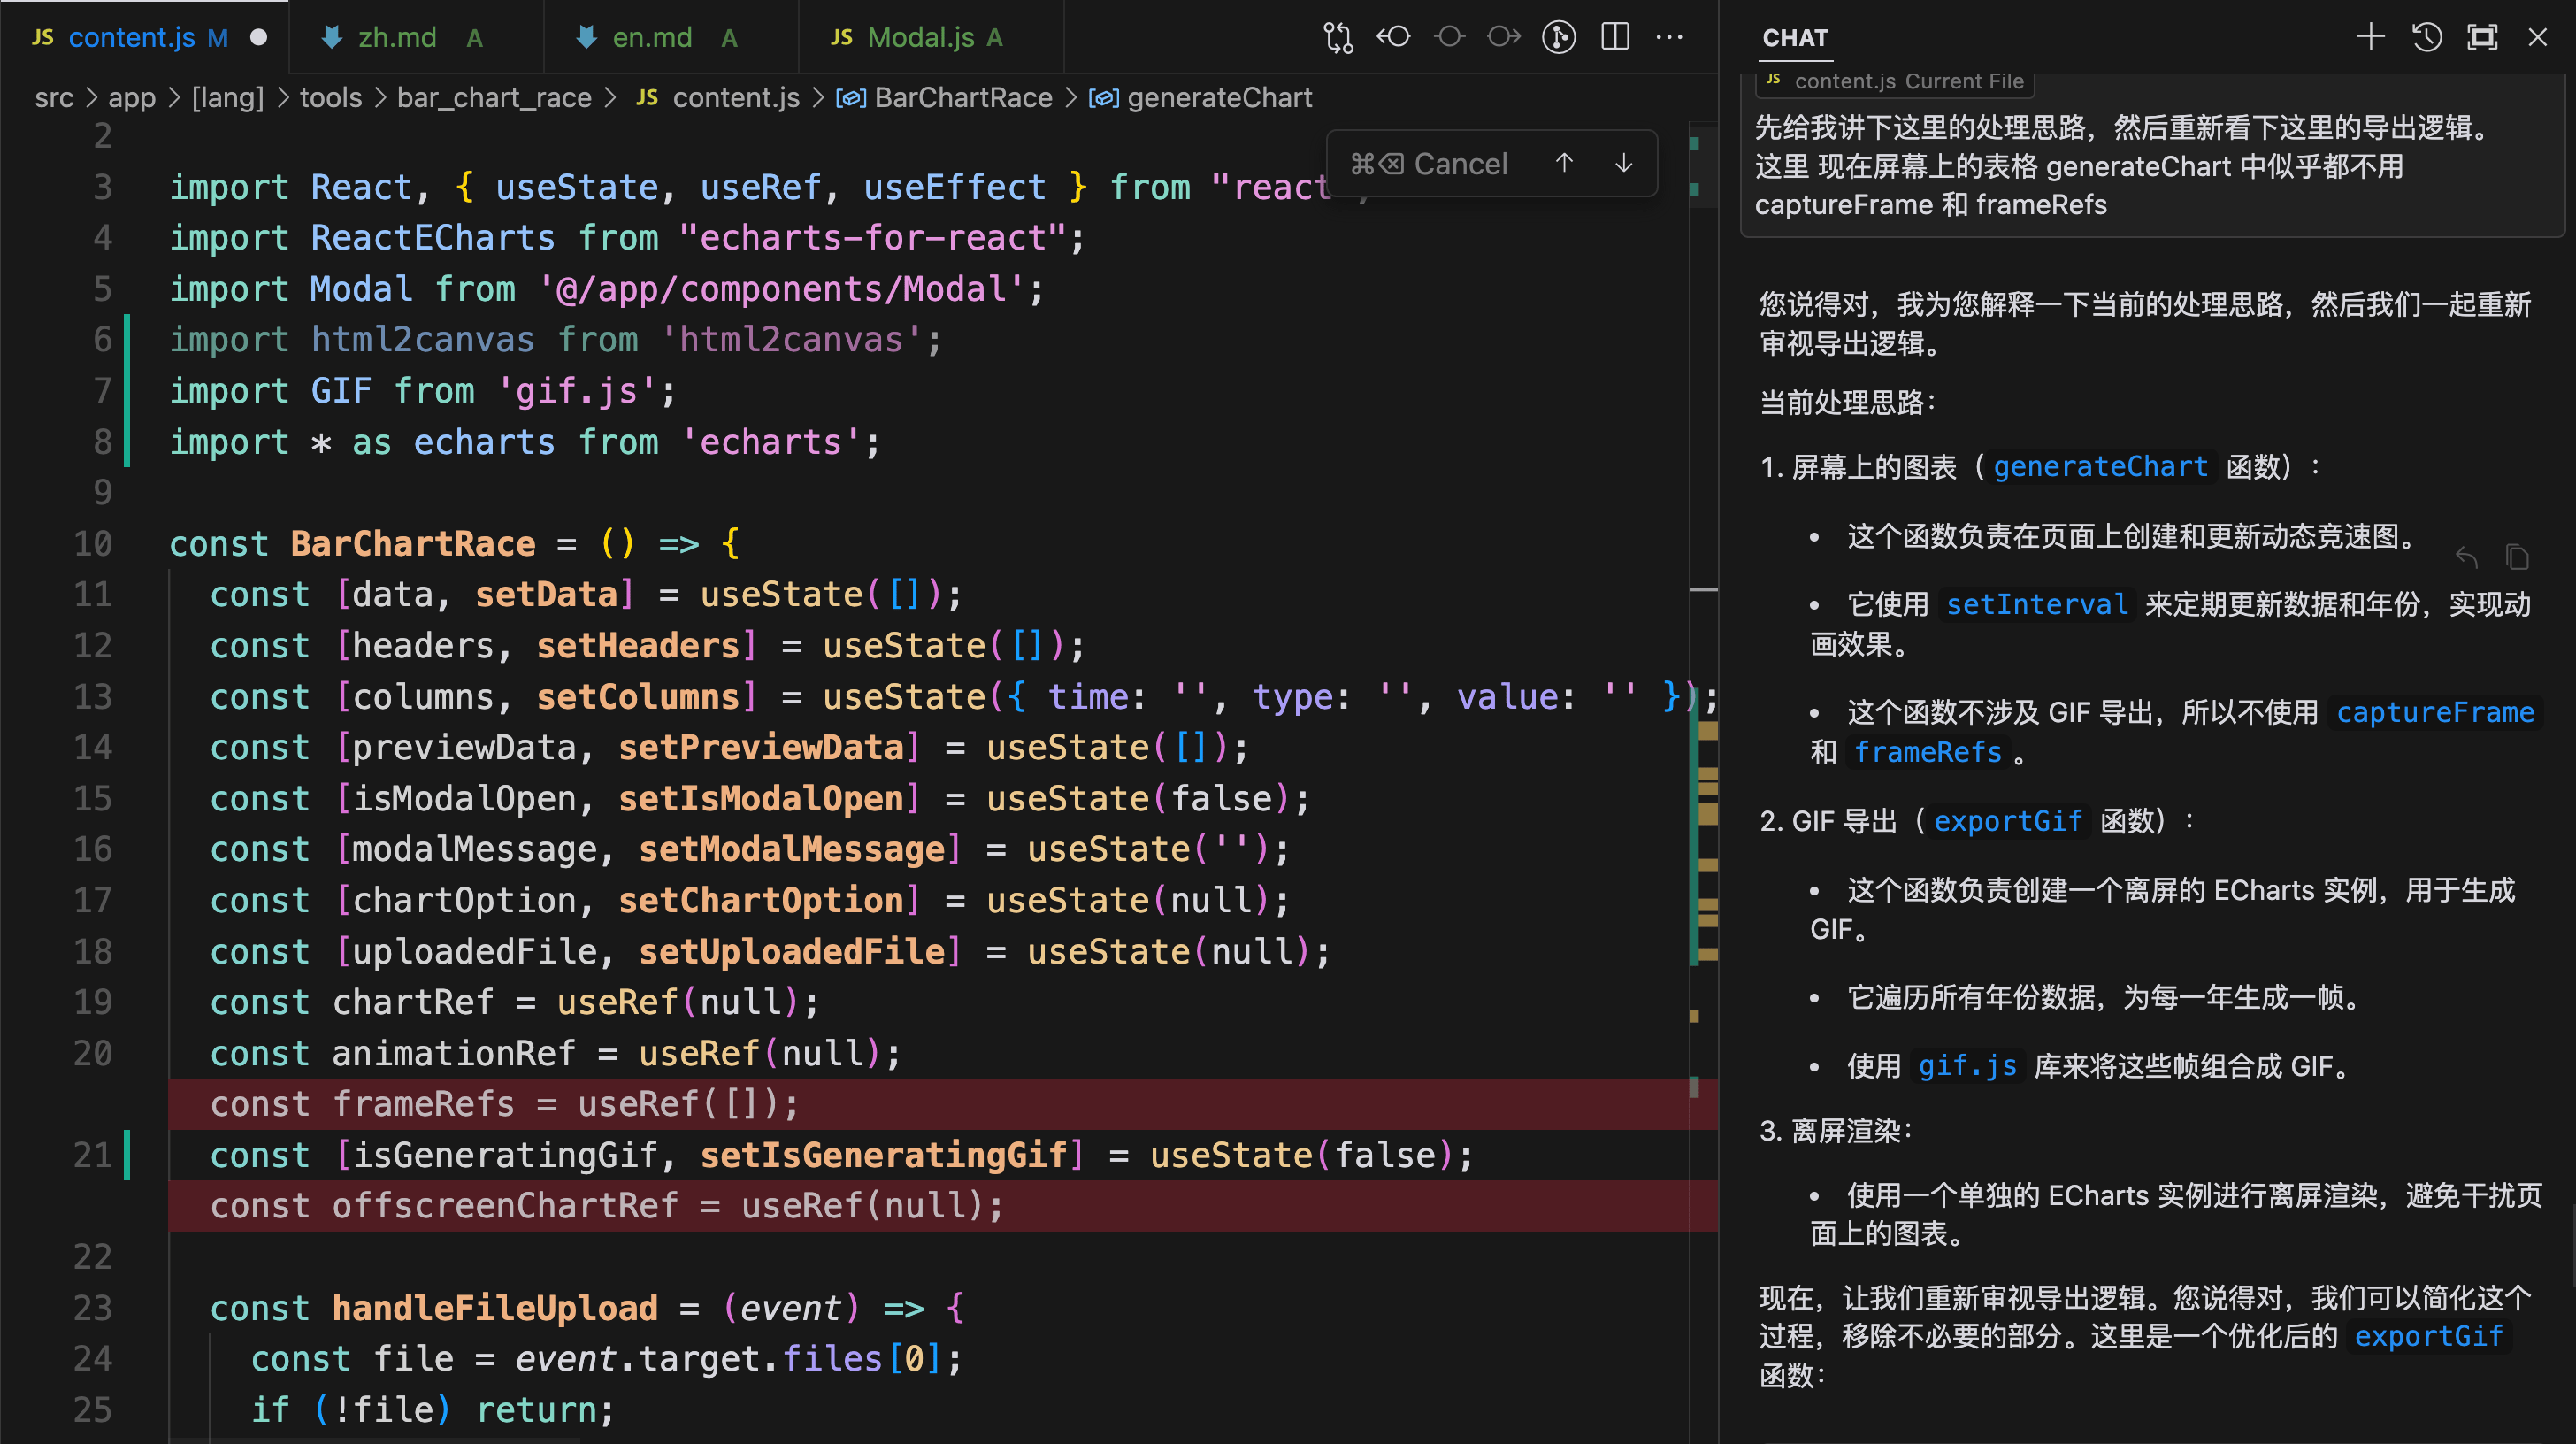
Another annoying thing is that Claude3.5 often forgets to delete excess code when making functional changes. For example, when a feature has changed its implementation, it often just adds code without deleting the unused code. Like in the image below, some states are not used during rendering, but they're still there. You have to prompt it to delete them, but fortunately, with a little prompting, it immediately knows how to delete.
Reflections on the Usage Process
After finding the right way to communicate with Claude3.5, writing a tool from scratch is quite fast. You only need to focus on the overall implementation idea, then try to break down the task as much as possible, and AI can basically complete each step quite well. When encountering bugs, a quick look at the code usually solves the problem.
Sometimes a single model might get stuck in a rut, so it's worth trying to switch models. This time, when generating GIFs, Claude3.5 couldn't solve the problem after troubleshooting for half a day. Later, switching to GPTo1 and starting a new conversation directly gave a good troubleshooting direction, solving the problem immediately.
Here's another personal tip: in some long conversations, AI will carry a lot of context with each question, and the accuracy of answers will decrease significantly. At this time, starting a new conversation might yield much better results.
Is there a tool you want? Try implementing it with Cursor.